
Data analytics in private equity: how PE firms use data from deal to exit
How PE firms use data analytics across sourcing, diligence, monitoring and exit, and why location-level diagnosis now drives value creation in 2026.

How PE firms use data for smarter investments
Data analytics in private equity is the use of financial, operational and market data to decide which companies to buy, how to run them during the hold, and when to sell. In 2026, the firms pulling ahead use it for more than fund reporting. They use it to find and fix underperformance inside every portfolio company, location by location.
That last part is where most programs stall.
Firms have dashboards. They have data rooms, portfolio monitoring software and monthly board packs. What they rarely have is a read on every unit: why each clinic, store or branch moved, and what its manager should do this week.
This guide covers:
- What data analytics in private equity means across the deal lifecycle
- Why it matters more now than it did five years ago
- What data PE firms collect from portfolio companies, and why it is so hard to aggregate
- Where AI fits, and where it does not
- A practical build order for operating partners and portfolio CEOs
Data analytics in private equity

- Firms pull ahead
- Run companies
- Sell companies
- Growing importance
- Guide topics
What is data analytics in private equity?
It is the practice of turning data into investment and operating decisions at every stage of a fund's life. The deal team uses it to pick targets. The operating team uses it to run them. The CFO uses it to prove the value at exit.
Deloitte's view of data-driven private equity frames the same arc: data supports fundraising, deal sourcing, pre-deal review, value creation and portfolio monitoring.
Think of it as two halves:
- The deal side (sourcing, pre-deal review) is crowded with data vendors and research tools.
- The hold side (value creation, monitoring, exit) is where returns are now made or lost, and where PE operating partners still work from lagging reports.
Why does data analytics matter more in private equity in 2026?
Because the math changed. Returns now have to come from operations, and operations only improve when someone can see what is happening inside the business.
Bain's 2026 Global Private Equity Report explains the shift:
- Multiples did the heavy lifting: In the low-rate decade leading up to 2021, rising multiples powered over 50% of buyout returns.
- The bar moved: A typical deal once needed about 5% annual EBITDA growth to return 2.5x over five years. Bain's rule of thumb now is "12 is the new 5."
- Holds got longer: Buyout holding periods at exit hover around seven years, up from five to six between 2010 and 2021.
- Inventory piled up: The industry sits on roughly 32,000 unsold companies worth $3.8 trillion.
Seven years is a lot of operating cycles. Every quarter a location drifts unnoticed is margin that never reaches the exit multiple.
That is why value add in private equity is under pressure to show real numbers, not slideware.
AI is accelerating the shift. In Alvarez & Marsal's 2026 value creation survey, 63% of respondents now use AI in value creation work, up from 41% in 2025.
The firms that win are the ones that shorten the gap between a number moving and a manager acting on it. Scoop calls that decision velocity.
Drive stronger returns through operational improvement
Operations
Returns must come from operations
Visibility
See what is happening inside
EBITDA growth
12 is the new 5
Real numbers
Show real numbers, not slideware
Exit multiple
Margin reaches the exit multiple
AI
Accelerating the shift
How do PE firms use data analytics across the deal lifecycle?
Each stage asks a different question, so each stage needs different data and a different owner.
- Sourcing asks "what should we buy?"
- The pre-deal review asks "what are we really buying?"
- The first 100 days ask "where do we start?"
- Monitoring asks "is it working?"
- Exit asks "can we prove it?"
The deal side is well served by tools. The hold side still runs on a handful of experienced people reading reports, which is why Neil Shepherd argues AI decision management is inevitable for distributed businesses.
Deal sourcing and screening
Data analytics shortens the list. Deal teams screen thousands of private companies against a thesis before a banker ever calls.
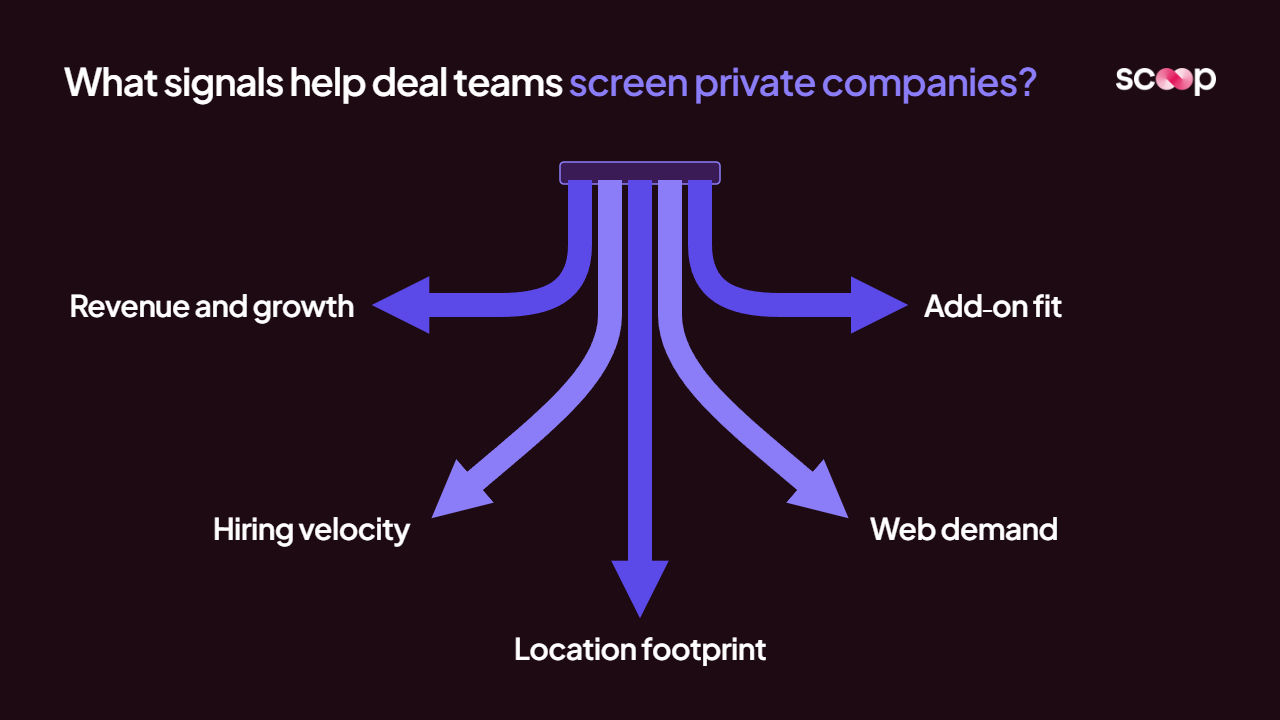
Common screening signals include:
- Revenue and growth proxies from private company databases
- Hiring velocity and headcount changes
- Location openings, closures and footprint density
- Web traffic, reviews and search demand
- Add-on fit for an existing platform
Bain notes that GPs are exploring AI everywhere from deal sourcing and pre-deal review to value creation. On the deal side, much of that is summarization: reading CIMs, filings and call notes faster. Useful, but dashboard summaries are not the same as investigating why a business performs the way it does.
Pre-deal review (the due diligence)
Due diligence is the review a PE firm runs on a company before it buys it. It now has a second question beyond "are the numbers right?" It is "can we run this business with its data?"
Baker Tilly's private equity practice flags the data maturity of a target company as a core part of the pre-deal review. The odds are not great. Accordion's 2026 PE AI Adoption Benchmark found that 75% of portfolio companies arrive either unprepared or only partially ready for AI deployment.
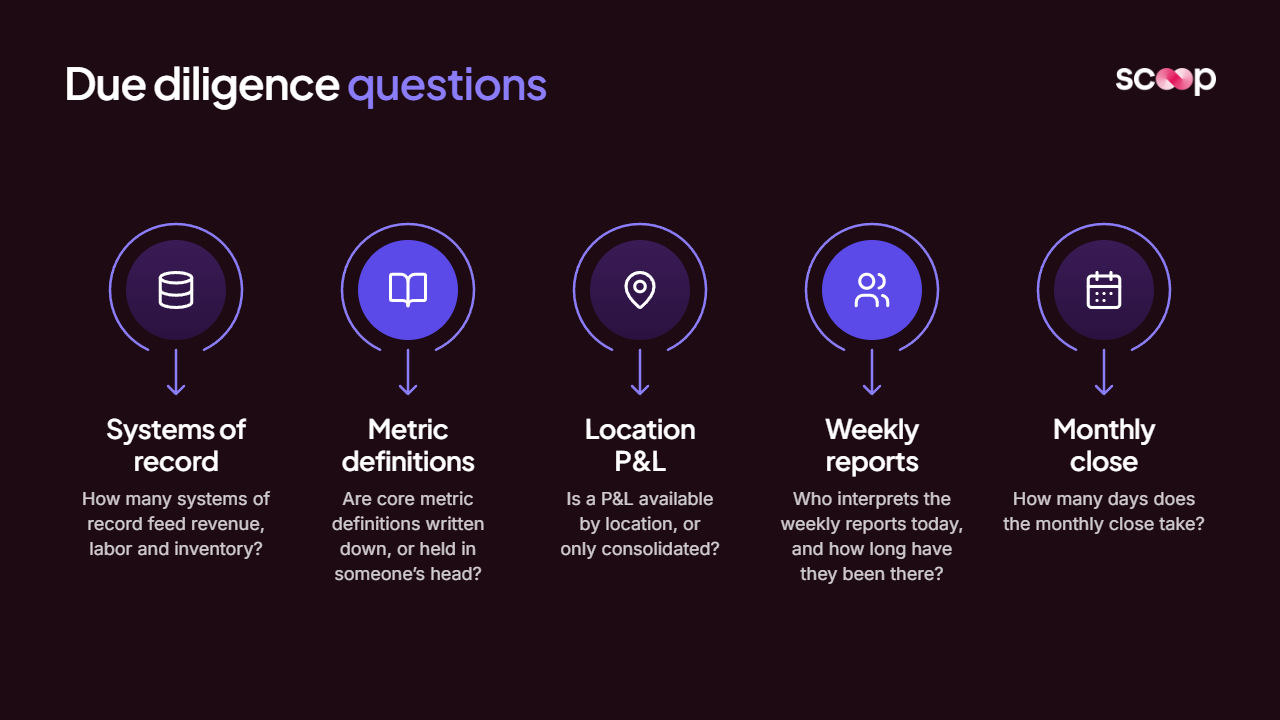
Questions worth adding to every pre-deal review:
- How many systems of record feed revenue, labor and inventory?
- Are core metric definitions written down, or held in someone's head?
- Is a P&L available by location, or only consolidated?
- Who interprets the weekly reports today, and how long have they been there?
- How many days does the monthly close take?
Question four matters more than it looks. If the operating judgment sits with one long-tenured COO, the business can lose operational knowledge the day that person leaves.
The first 100 days after close
The first 100 days set the baseline every later claim gets measured against. Get it wrong and the exit story has no anchor.
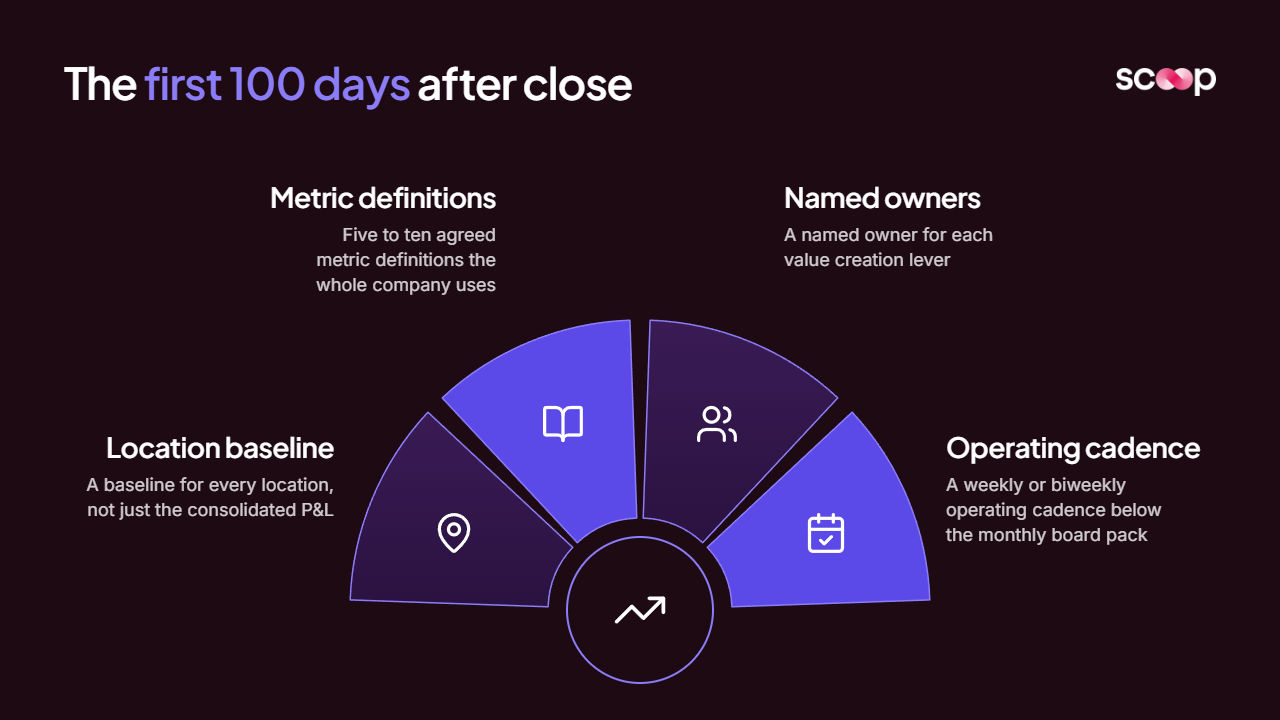
What a strong 100-day data plan locks in:
- A baseline for every location, not just the consolidated P&L
- Five to ten agreed metric definitions the whole company uses
- A named owner for each value creation lever
- A weekly or biweekly operating cadence below the monthly board pack
Most firms underestimate how dark the business goes during integration. Brad Peters walks through what happens to operational visibility in the 90 days after an acquisition, when systems, people and definitions all change at once.
Portfolio monitoring
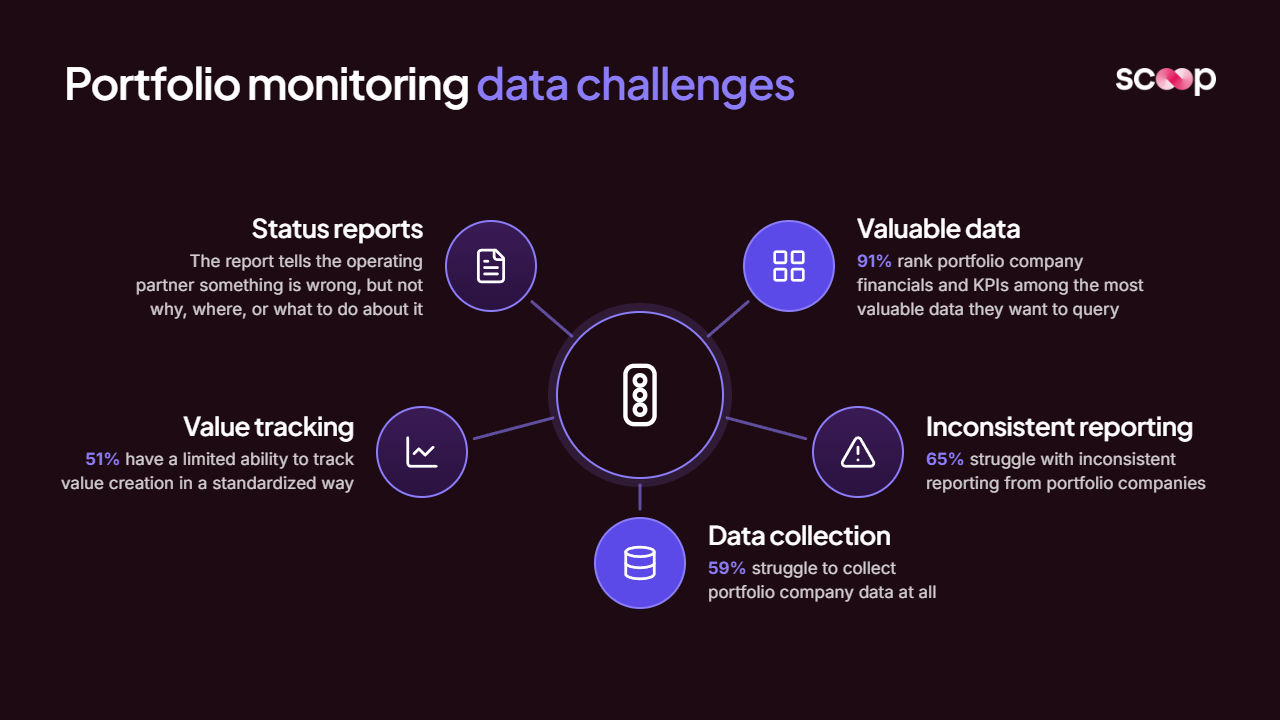
Monitoring is where the gap between data and decisions is widest. The Allvue 2026 GP Outlook Survey puts numbers on it:
- 91% of firms rank portfolio company financials and KPIs among the most valuable data they want to query
- 65% struggle with inconsistent reporting from portfolio companies
- 59% struggle to collect portfolio company data at all
- 51% have a limited ability to track value creation in a standardized way
Even when the data arrives, it usually arrives as a status. Green, yellow, red. That is the red/yellow/green trap: the report tells the operating partner something is wrong, but not why, where, or what to do about it.
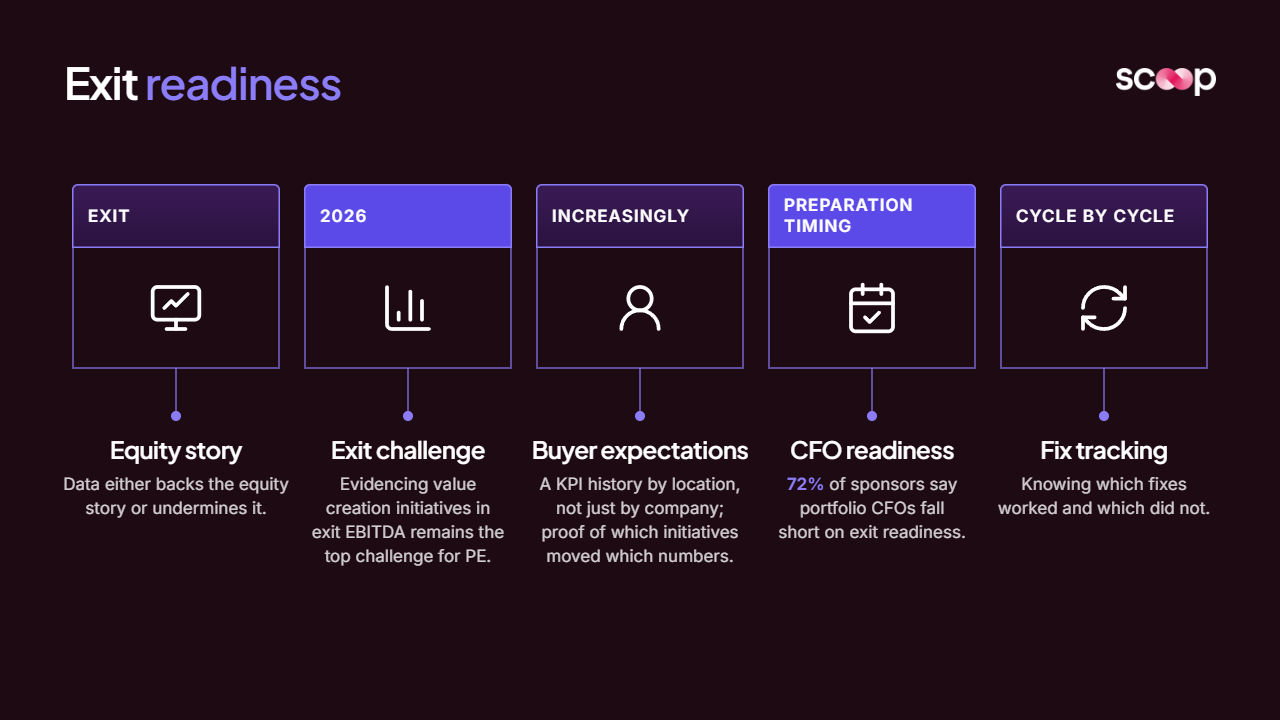
Exit readiness
Exit is where the data either backs the equity story or undermines it. EY's Global PE Exit Readiness Study 2026 found that evidencing value creation initiatives in exit EBITDA remains the top challenge for PE, and the one with the biggest effect on exit outcomes.
What buyers increasingly expect to see:
- A KPI history by location, not just by company
- Proof of which initiatives moved which numbers
- Consistent definitions across every acquired entity
- A credible view of how AI fits the business
Preparation timing matters. Accordion's sponsor and CFO survey found 72% of sponsors say portfolio CFOs fall short on exit readiness. The fix is not a better data room. It is knowing, cycle by cycle, which fixes worked and which did not.
What data do PE firms collect from portfolio companies?
Most firms collect financials well and operations poorly. The financial layer is standardized by accounting rules. The operating layer is not.
Deloitte lists the categories leading firms now gather:
- Portfolio company financial data
- Customer and supplier data
- Workforce data
- ESG data
- Operational data
The operational layer is where value creation happens, and it is different in every vertical:
The healthcare row comes straight from a value creation lead at a healthcare-focused PE firm, describing the metrics the team already pulls daily into Power BI.
Collecting these is the easy part. The hard part is knowing that clinic 23 is behind clinic 1 for a reason the average hides. That spread is location performance variance, and in a roll-up it is usually where the unrealized EBITDA sits. To find it, you have to benchmark locations on a like-for-like basis first.
Why is private equity data so hard to aggregate and keep accurate?
Because roll-ups buy systems, not just companies. Every acquisition arrives with its own software, its own field names, and its own definition of "a good month."
"No two businesses look the same, so it's hard to lift and shift."A value creation lead at a healthcare-focused PE firm
The usual failure points:
- Many systems of record: One roll-up Scoop reviewed ran 23 different practice management systems.
- Conflicting definitions: "Net revenue" means three things in three acquired entities, and the person who defined it left years ago.
- Moving locations: Clinics open, close, merge and change managers, so last quarter's mapping breaks.
- Manual stitching: Teams export to Excel each month and reconcile by hand.
- Numbers that look right but are not: An investor at a lower-middle-market PE firm described how even their best-run home care business still had patient census data that was "a little funky," and fixing it meant going back into the source systems to find what was feeding the number.
Grant Thornton's 2026 AI Impact Survey adds a warning: inside portfolio companies, AI is often deployed before data definitions are consistent or reporting ownership is clear.
Not every roll-up starts in the same place. An operating partner at a large-cap fund put it simply: a platform built from a handful of regional operators on a few systems is a far faster start than one assembled from dozens of independents. That is the reality behind PE-backed roll-ups where every clinic runs a different tech stack.
Built for the businesses that run everywhere at once.
Scoop exists to bring best-in-class operational diagnostics to every distributed business, not just the ones big enough to staff a team for it. Meet the people building it.
- Operator-first by design
- Built for distributed teams
- Diagnostics, not dashboards
How do PE firms make sure portfolio data is accurate?
They stop treating accuracy as a one-time cleanup and start treating it as a cycle.
- Agree definitions for the few metrics that drive the plan: Five to ten, not two hundred.
- Map at the source: Translate each system's fields and location names to one standard.
- Auto-apply confident matches, route the rest to a person: Exceptions go to someone who knows the business.
- Reconcile to the financials every cycle: If location totals do not tie to the P&L, the report says so.
- Flag structural changes: New location, closed location, manager listed twice.
- Fix the fields decisions depend on first: Everything else can wait.
This is how Scoop handles private equity rollups: the mapping runs automatically and the operating team handles the exceptions. It is also why waiting for perfect data is a trap. As Brad Peters argues in clean data first, clean enough never arrives. The end of the hold period does.
Portfolio data accuracy cycle
Agree key definitions
Five to ten, not two hundred
Map at source
Translate each system's fields and location names to one standard.
Route exceptions
Auto-apply confident matches, route the rest to a person.
Reconcile financials
Reconcile to the financials every cycle.
Flag structural changes
New location, closed location, manager listed twice.
Fix decision fields
Fix the fields decisions depend on first.
Why doesn't clean, aggregated data automatically create value?
Because aggregation answers "what happened." Value creation needs "why" and "what next." Those are different jobs.
"Good clean data in a centralized repository that's feeding leading indicators and lagging indicators about the business, on a consistent basis, for the right audience at the right cadence. That's gold."An investor at a lower-middle-market PE firm
It is gold. It is also where most programs stop. Once the data is centralized, three problems show up:
- Averages hide the problem: A portfolio company can hit plan while a fifth of its locations slide. Aggregate metrics hide exactly the stores, clinics or branches that need attention.
- Thresholds need judgment: The same healthcare value creation lead found that with their original scoring bands, 80% of clinics showed red. Tuning thresholds so the signal means something takes someone who knows the business.
- Insight is not control: Operating partners see the problem but do not run the locations. The general manager holds the levers, and a dashboard does not tell them what to change.
This is the interpretation gap. BI shows what happened. Someone still has to read it the way your best operator would, for every location, every cycle. That someone does not scale.
Your dashboards show what happened. Scoop says what to do.
Scoop adds the diagnostic and action layer your BI tools cannot: finding what needs attention across every location, and what to do about it. Your stack stays exactly where it is.
- Sits on top of your BI
- Diagnostic and action layer
- No migration required
What does AI add to private equity data analytics?
AI adds reach. It can read every location, every cycle, without waiting for an analyst. What it does not add on its own is judgment about your business.
Adoption is real, results are thinner. Grant Thornton found 45% of PE leaders are still piloting AI and only 5% have fully integrated it into operations. Accordion calls this "pilot purgatory."
Most PE use of AI falls into three layers:
- Deal-side acceleration: Summarizing CIMs, filings, expert calls and deal documents.
- Finance automation: Close, consolidation, forecasting and board-pack assembly.
- Operating judgment at scale: Diagnosing every location and telling each manager what to do next.
The third layer is the one that moves EBITDA, and the one most firms build by hand.
A common pattern: a value creation team connects an LLM to its Power BI data to prep site visits. One firm described a regional director with three days in market. The model picks two days of underperforming clinics and one day congratulating the top three, then drafts an interview guide for each clinic director.
That is genuinely useful. It is also event-driven. It runs when someone asks, not every cycle, and it carries no memory of how the COO actually reads those numbers. A general model sitting on BI data needs a harness: your definitions, your thresholds, your operator's logic.
The goal is decision augmentation, not automation. The manager still decides. They just stop deciding blind. Neil Shepherd's view is that every frontline leader will eventually work with an AI decision agent that carries the company's best judgment into each review.
AI in private equity data analytics
Decision augmentation
The manager still decides;
they just stop deciding blind
Operating judgment
Diagnosing every location and telling
each manager what to do next
Finance automation
Close, consolidation, forecasting
and board-pack assembly
Deal-side acceleration
Summarizing CIMs, filings, expert
calls and diligence documents
How does AI performance management work inside a portfolio company?
AI performance management captures how your best operator reads the numbers, then runs that logic across every location, every cycle, and delivers a diagnosis and action plan to each manager. It sits on top of the portfolio company's existing BI. Nothing gets ripped out.
Capture starts with a conversation, not a configuration screen. Brad Peters describes it this way:
"If I took a tape recorder and recorded everything you thought as you looked at your BI reports, we stick that into the system so it could do that on your behalf."Brad Peters, Scoop co-founder and CEO
From there, how Scoop works follows a fixed sequence:
- Screening: Every location is checked against the operator's criteria each cycle: year-over-year deviations, ratio imbalances, early warning signals.
- Flag and spawn: When a screen trips, the system decides whether to open an investigation into that location.
- Probes: Each investigation runs 15 to 30 defined analyses, each with rules for how to read the result.
- Multivariable analysis: A machine learning decision tree tests 10 to 20 variables at once to find what changed versus a healthier period.
- Synthesis and roll-up: Findings are written up per location, then rolled up: location, district, region, portfolio company, fund.
Brad's framing for this is "not AI let loose." It has the guard rails of how that specific business evaluates its own data.
In one live deployment at a multi-location retail chain with more than a thousand stores, the COO's way of reading the business became 18 to 20 standing investigations. Every two weeks, each store manager and district manager receives a plain-English briefing: what moved, why it moved, whether it matters, and what to do. Nobody logs in. The report arrives.
Action plans can be graded, too. Neil Shepherd describes a spectrum that runs "from a nudge if it's somebody you trust all the way to a shove" when a problem keeps going unaddressed. A respected clinician and a new store manager should not get the same tone.
For PE owners, the setup is deliberately light. Scoop's team sits with the operators, works from read-only access to the existing BI stack, and keeps the data inside the company's environment.
How should a PE firm build its data analytics capability?
Start with the decisions, not the data platform. A seven-year hold rewards firms that get a working cadence in place in the first year.
A practical build order:
- Score data maturity before the deal closes.
- Pick the five to ten metrics that carry the value creation plan: Lock the definitions in the first 100 days.
- Connect what exists: Read-only access to current systems beats a warehouse project that finishes in year three.
- Capture your best operator's judgment: Record how they read the numbers before that knowledge walks out the door.
- Run every location, every cycle: The stores costing you margin are usually the ones the weekly review never reaches.
- Track whether actions worked: Last cycle's recommendation becomes this cycle's evidence.
- Roll it up to the fund with the reasoning attached: The operating report explains the number instead of coloring it.
Where to start in a portfolio:
- Best first candidates: platforms on one or a few systems, with 20 or more locations and a clear operating leader.
- Harder starts: roll-ups assembled from dozens of independents on legacy software. Map first, then add interpretation in waves.
Speed matters here. Scoop's implementation runs to a live pilot in about four weeks, because it starts from the data the company already has.
Codify what your best operators already know.
Scoop captures your operators' tribal knowledge, screens every location automatically, and delivers role-specific action plans. Nobody writes a prompt. The plan just arrives.
- Codified tribal knowledge
- Automatic screening
- Action plans, not dashboards
Frequently asked questions about data analytics in private equity
What is data analytics in private equity?
Data analytics in private equity is the use of financial, operational and market data to source deals, review targets before buying, plan value creation, monitor portfolio companies and prepare exits. The fastest-growing use is operational: diagnosing performance inside portfolio companies, location by location, during the hold.
How do private equity firms make sure their fund and portfolio data is accurate?
They agree definitions for a small set of metrics, map each system's fields to one standard, reconcile location data to the financials every cycle, and route exceptions to people who know the business. Accuracy is maintained continuously, not fixed once.
What is private equity data aggregation?
Private equity data aggregation is the process of pulling financial and operating data from many portfolio companies, and many systems inside each one, into a consistent view. In roll-ups it is hard because each acquisition brings different software and definitions. Aggregation is necessary, but on its own it only tells you what happened.
What KPIs should PE firms track across portfolio companies?
Track the five to ten metrics that carry the value creation plan, at the location level. That typically means revenue and margin by location plus two or three operating drivers specific to the sector, such as patients per provider in healthcare or labor cost % in restaurants. Ask why this store is down before adding more metrics.
What tools do PE firms use to assess portfolio performance?
Most firms combine portfolio monitoring software for fund-level reporting, BI tools such as Power BI or Tableau inside portfolio companies, and Excel for everything in between. The missing layer is interpretation: something that reads the BI data the way an experienced operator would and turns it into actions. The build vs buy analytics question usually comes down to who will maintain that layer.
Do portfolio companies need clean data before using AI analytics?
No. They need agreed definitions for the metrics that matter and a way to handle exceptions. Waiting for fully clean data usually means waiting past the hold period. Starting with existing data shows quickly which fixes actually change decisions.
How is AI used in private equity today?
On the deal side, AI summarizes documents and speeds up screening. In finance, it automates close and reporting. In operations, AI performance management, the approach the Scoop team built for distributed businesses, diagnoses every location each cycle and delivers role-specific action plans, with a human deciding what to do.
Get insights like this every week
Analytics, ops strategy, and product updates. No noise.
Keep reading
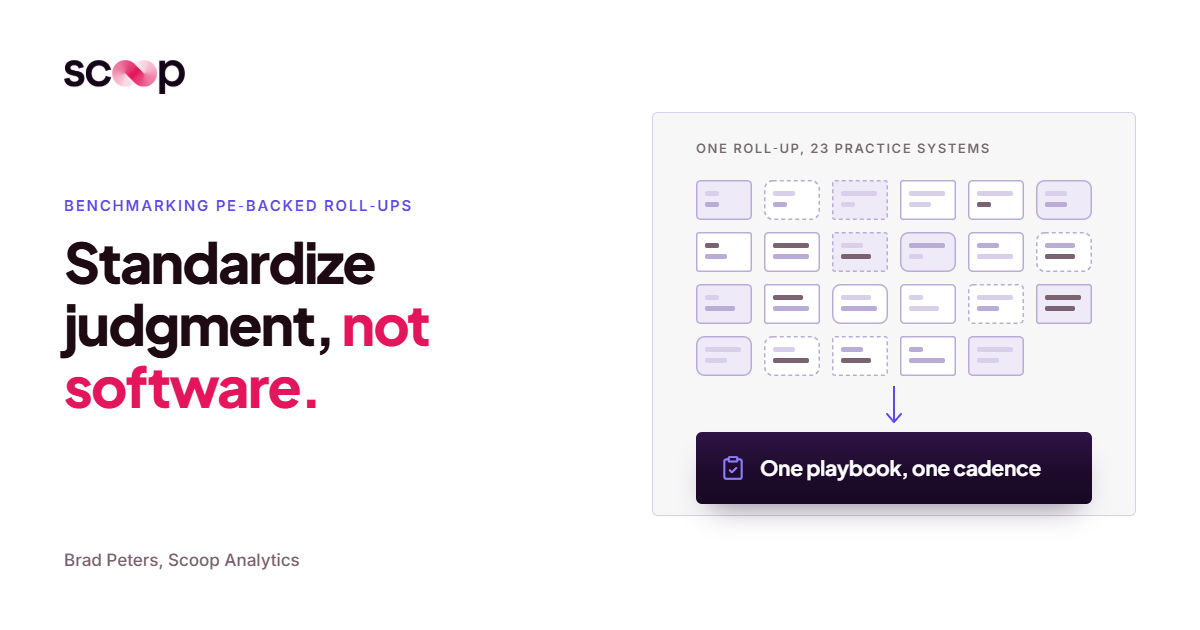
How do PE-backed roll-ups benchmark location performance when every clinic has a different tech stack?
Labor cost percentage: a roll-up found 40% excess labor. Your monthly report wouldn't have.
Labor cost percentage: a roll-up found 40% excess labor. Your monthly report wouldn't have.
Book a discovery call
Reach out to start a two-way conversation about your industry, your performance variations across locations, and whether Scoop is the right fit for you.