
The Red/Yellow/Green Trap: Why PE Operating Reports Need a Story, Not a Status
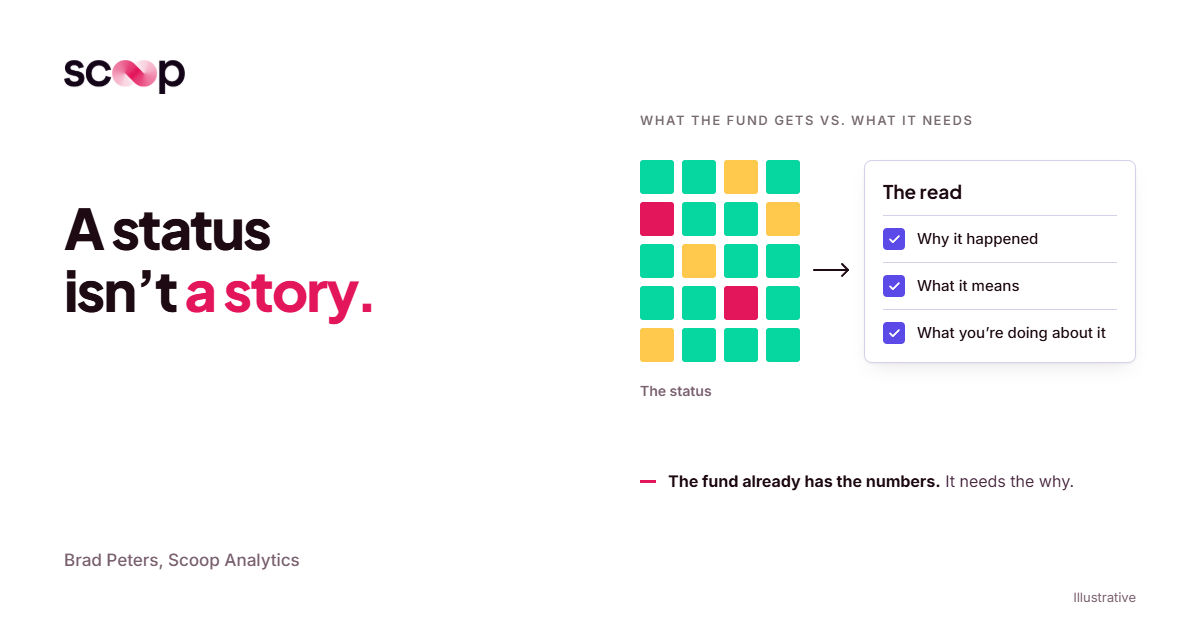
A red/yellow/green status tells a fund what happened at each location. It doesn't tell them why, what it means, or what you're doing about it. That missing piece is the read on each location, and it's what funds are really asking for when they push back on a color-coded monthly operating report.
Neil and I spent some time recently with the CEO of a PE-backed multi-location business. Every month, their team sends the fund an operating report. The fund rolls it up again for its limited partners.
He described the format the way most operators would:
"Most things do work on a green, yellow, red."
Then he said the part that stuck with me. The fund already gets the numbers. What makes the conversation useful is something else:
"It's not just about whether they performed or didn't perform."
I've been building reporting for operators for enough time to be able to see that the pattern hasn't changed in 20 years: the colors get automated first, and the explanation gets left to whoever has time.
Status is what's easy to produce
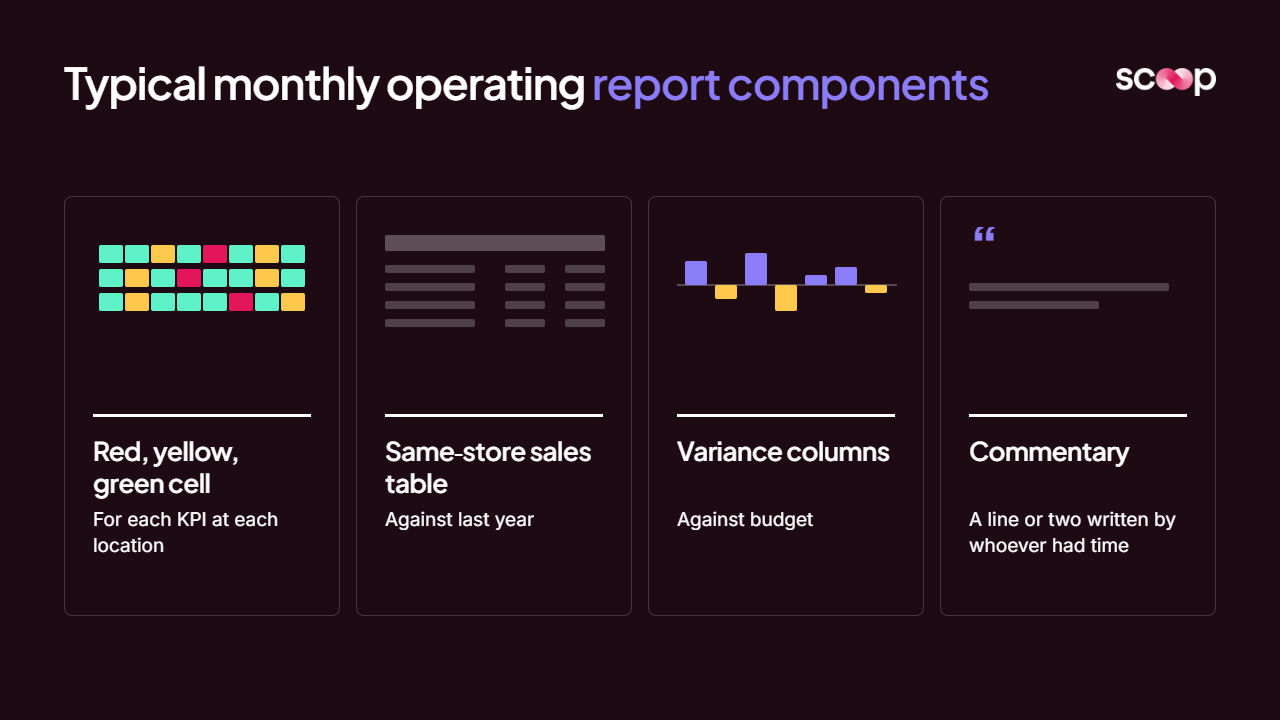
Look at what goes into a typical monthly operating report, whether the fund calls it an MOR, a flash report or a KPI pack:
- A red/yellow/green cell for each KPI at each location
- A same-store sales table against last year
- Variance columns against budget
- A line or two of commentary, written by whoever had time that week
A template can produce everything on that list except the last line. So the last line is the one that gets thin.
In PwC's Next in Private Equity survey, 61% of portfolio companies said they build a report or deck by hand to share data with their PE firm. The founder was blunter:
"We all spend way too much time putting these MORs together."
When the hours go into the colors, there's nothing left for the explanation.
The question comes on the fund call
The call goes fine until someone points at a red.
"Why did that location underperform?"
If the answer is "we're looking into it," you've told the fund you know as much as they do: what happened, not why.
Funds feel that pressure from their own investors.
KPMG, citing an MSCI survey, reports that 52% of small GPs and 68% of large GPs say they can't meet their LPs' bespoke reporting demands in real time.
The fund needs a story to pass up the chain. If you don't give them one, they'll write their own, with less context than you have.
The fund gets a clean pull of the numbers, but "the cut of the numbers is everything".
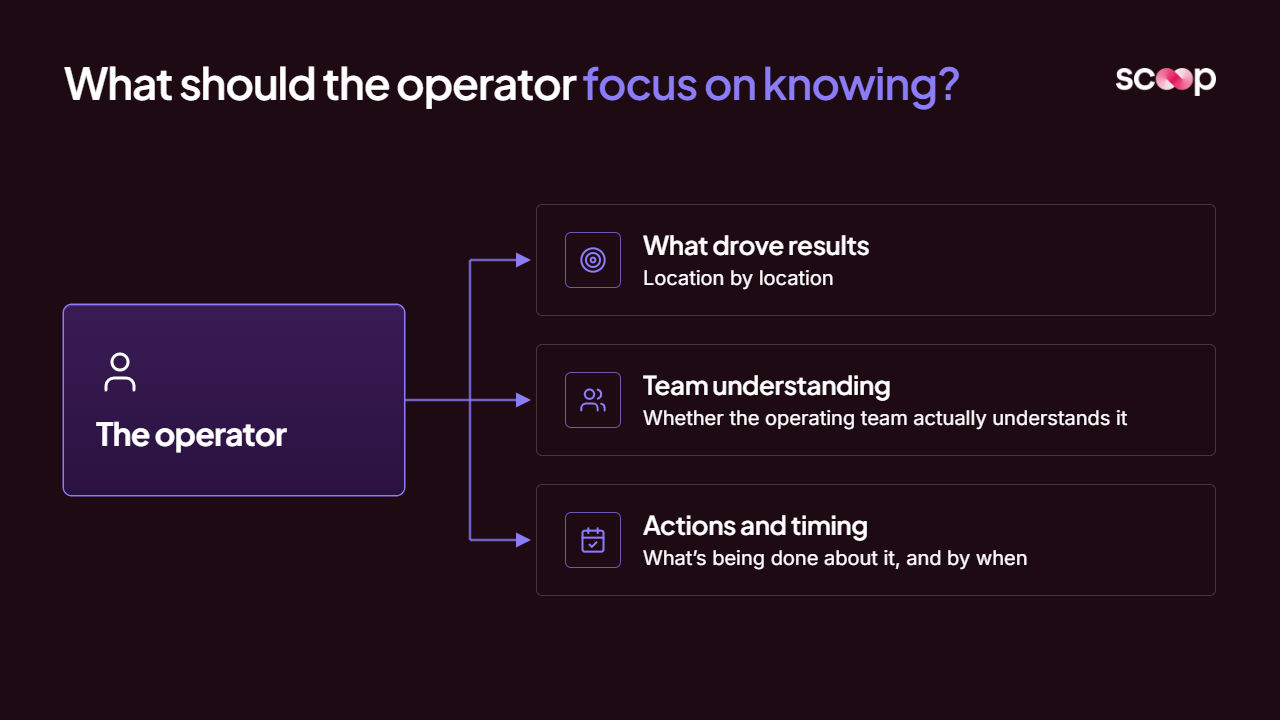
Whoever explains the numbers owns the narrative, and the operator should be focused on knowing 3 things:
- What drove the result, location by location
- Whether the operating team actually understands it
- What's being done about it, and by when
A color answers none of them.
Same yellow, different problems
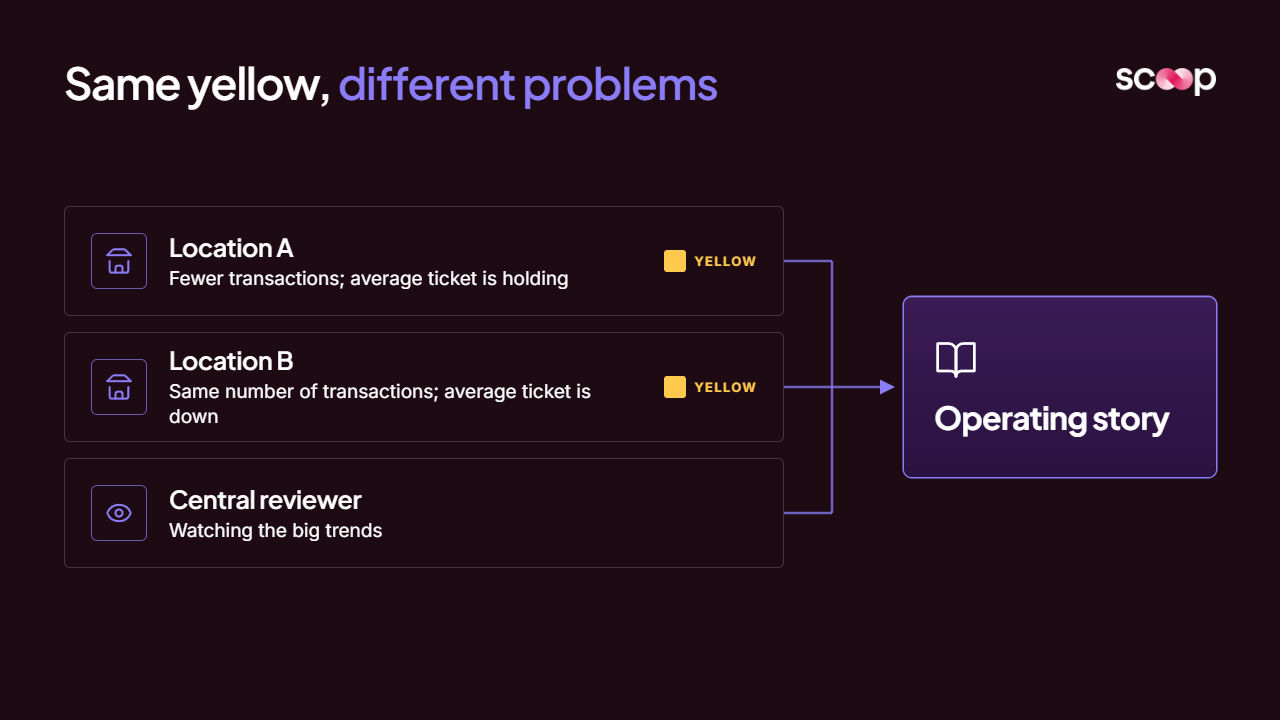
Two locations both come in yellow on same-store sales. Same color, same size of miss. The report treats them the same.
Now look underneath:
- Location A has fewer transactions, but the average ticket is holding.
- That's a traffic problem: bookings, marketing, staffing gaps on busy days, a provider who left.
- Location B has the same number of transactions, but the average ticket is down.
- That's a mix problem: more discounting, fewer add-on services, a shift toward lower-value treatments.
They need opposite responses. A marketing push at Location B does nothing. Upsell coaching at Location A does nothing.
The color carried no operating information.
The story sits in the layer between the metric and the status: which driver moved, compared to what, and what the manager should do about it on Monday.
That's also why one person reviewing the report centrally can't close the gap.
The average Power BI deployment has about a hundred dashboards and almost nobody knows how to read them. Even a strong central reviewer is watching the big trends.
They aren't looking at how each location is off, or why one region runs differently from the next.
The story starts with the operating team
People outside a roll-up tend to assume the fund's operating partners make the hard calls. In practice, the CEO and the operating team own most of the judgment, and the fund reviews it.
Look at what this operating team already does:
- Runs monthly operating reviews directly with each clinic
- Ranks clinics against each other so managers see where they stand
- Sends every injecting provider a monthly pulse report showing their results against the group average
- Before one acquisition closed, used operating data to find a clinic carrying about 40% more labor than it should, and required a reduction before close
A red cell would have said "labor high". The read said that every new dollar of revenue at that clinic would lose margin to excess labor, and it came with the fix.
The fund usually can't do this work for you, even if it wanted to.
KPMG found that operational value creation staff average 10% of employees at the largest PE firms, and that many firms will need to triple that ratio. Smaller funds have even fewer people. In the founder's words, they "don't have the horsepower."
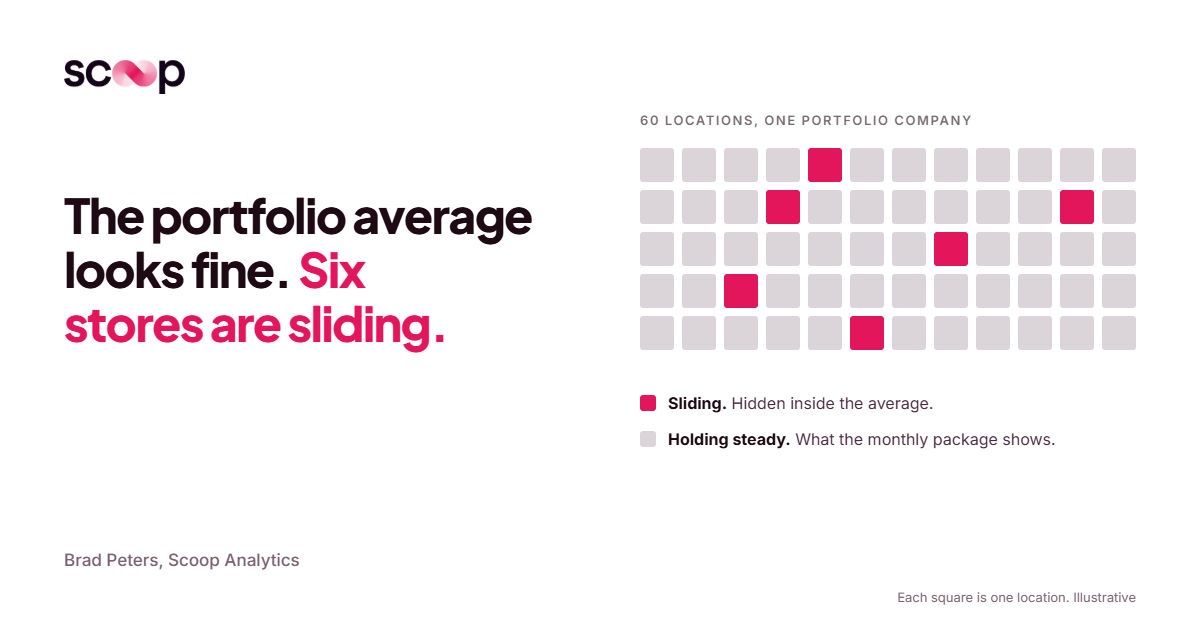
So when operating partners ask for visibility into portfolio company performance, what they need is the read from the people closest to the locations.
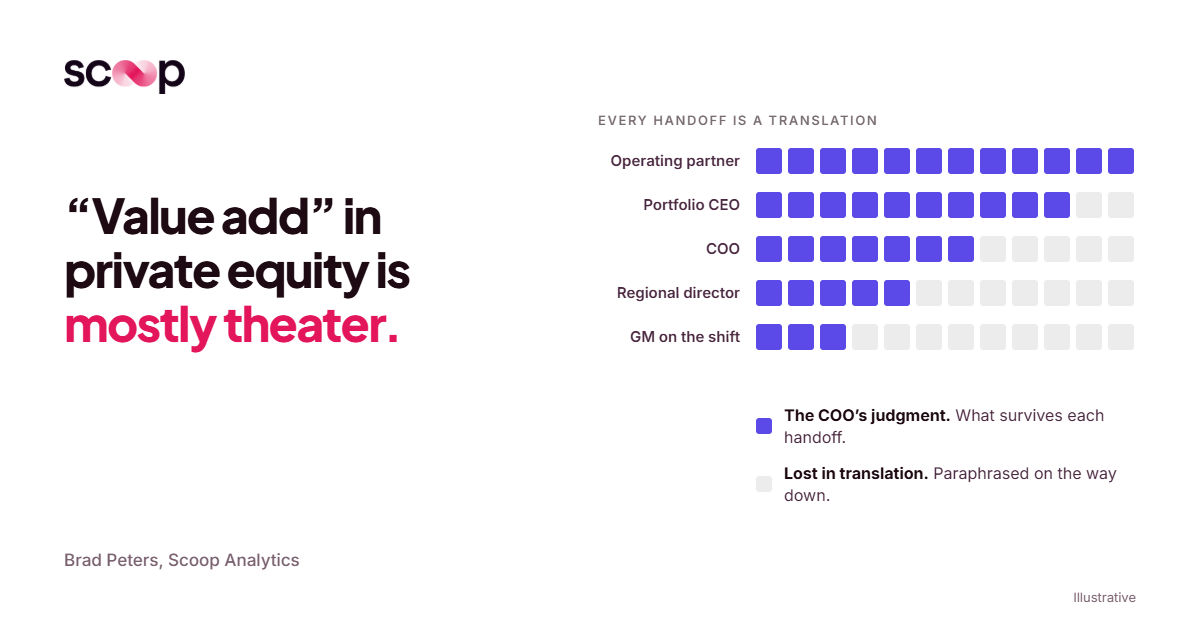
It's also why so much fund-level value add in private equity never reaches the P&L.
The story you tell the fund starts with the story you build inside your own company.
Why the commentary doesn't line up
Two things are fragmented in most roll-ups: the data and the judgment.
In Accordion's 2026 PE AI Adoption Benchmark, 71% of PE tech and AI operating partners named fragmented systems with no clean data layer as their top barrier to scaling AI in portfolio companies.
75% of portfolio companies arrive unprepared or only partly ready, and just 6% are ready within the first 100 days.
"Mapping is a mess, because every clinic names things differently."
At one point the CEO’s company ran 23 different practice management systems.
The judgment side gets less attention, and it does more damage to the MOR:
- Each district manager reads the numbers differently, so the commentary reads differently
- The locations that get a real explanation are the ones someone had time to look at
- New managers don't know what experienced ones check first
- Nobody has written down what good looks like
The CEO of a large retail chain we work with told me that if he asked 3 people on his team what one of their core warning patterns meant, he'd get 3 different answers.
That isn't a people problem. It's a playbook that was never written down.
The founder said many organizations;
"don't know how poorly they're doing this"
Codify what your best operators already know.
Scoop captures your operators' tribal knowledge, screens every location automatically, and delivers role-specific action plans. Nobody writes a prompt. The plan just arrives.
- Codified tribal knowledge
- Automatic screening
- Action plans, not dashboards
What a story-first report looks like
Every location gets the same read your best operator would give it. Not just the reds. Every location, every cycle.
Each location's brief answers four questions:
- What the figures establish: The metrics that moved, compared with last year, the plan and peer locations.
- What they suggest: The driver behind the move: traffic or ticket, labor or volume, mix or price.
- What to check: The specific things the manager should verify on the ground.
- What to do: Recommended actions ranked by severity, each with an owner, a target and a review date.
Then it rolls up from location to district to region to company. The COO sees the patterns. The fund gets a report where every color has a reason behind it.
I've shown what a read on every unit looks like in practice.
The red/yellow/green doesn't go away. It becomes the headline over the story instead of the whole report.
How we run it
We built Scoop to do this as a managed service. It sits on top of the BI, practice management and POS systems you already run. Nothing gets ripped out.
- Capture the playbook: Our team sits with your COO and your best regional leaders. I ask every COO the same question: "If I took a tape recorder and recorded everything you thought as you looked at your BI reports, could we stick that into the system so it could do that on your behalf?"
- Read every location: Every cycle, each location gets 30 to 50 checks against that playbook. When something trips, the investigation follows that location's own numbers. It's not AI let loose. An engine computes the figures, the AI interprets them within your rules, and our team reviews the cycle before anything goes out.
- Brief before the report goes up: Each location gets a brief with the severity, the finding and the recommended actions, before the MOR goes to the fund.
- Check it next cycle: Was the action taken, and did the number move? Anything still open carries forward.
The brief recommends. Your operators decide.
When the data can't explain a red, the brief says so. I'd rather tell a fund "open question, here's what we're checking" than hand them a story we made up.
On the call, I put it this way: a hundred instances of a general-purpose AI will get you a hundred random answers. A fund needs the opposite. Structured, consistent and trusted, every cycle.
Built for the businesses that run everywhere at once.
Scoop exists to bring best-in-class operational diagnostics to every distributed business, not just the ones big enough to staff a team for it. Meet the people building it.
- Operator-first by design
- Built for distributed teams
- Diagnostics, not dashboards
The color was never the question
Funds don't push back on your RAG dashboard because they want different colors.
They're asking for judgment:
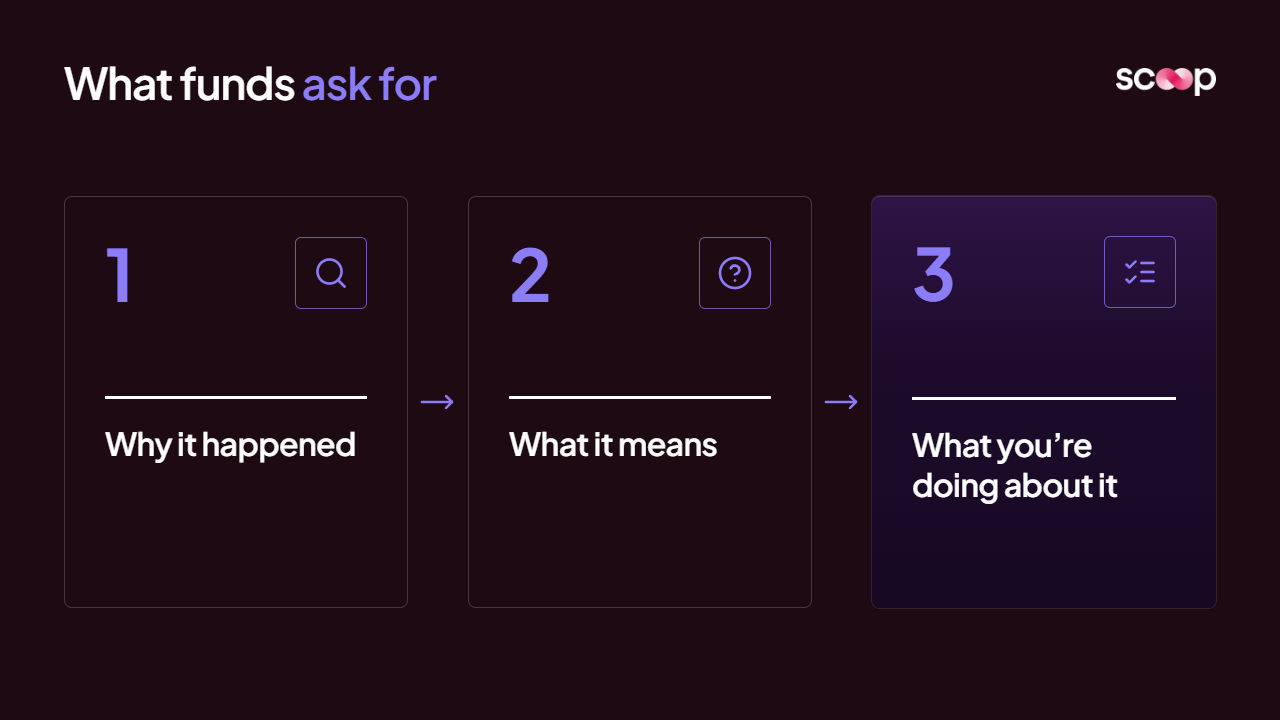
- Why it happened
- What it means
- What you're doing about it
Build that read for every location before the report goes up, and the fund call stops being an interrogation. It becomes a review of decisions you've already made.
If your operating partner asked about every red on your last MOR, how many could you explain?
Frequently asked questions
What is the red/yellow/green trap in PE reporting?
It's when a monthly operating report shows each KPI as a status color without explaining it. Two locations can show the same yellow for completely different reasons. The color tells the fund where to look, not what caused it or what's being done.
What should a monthly operating report include beyond KPI status?
For every location, it should cover:
- What the figures establish
- The driver behind the move
- What the manager should check
- Recommended actions with an owner, a target and a review date
Why can't the fund's operating partners build the story themselves?
Most funds don't have the people. KPMG found operational staff average 10% of employees at the largest PE firms, and smaller funds have fewer. The judgment also lives with the operating team, which is closest to the locations.
Does a story-first MOR mean replacing our BI tools?
No. The read sits on top of the BI, practice management and POS systems you already run. It adds the interpretation between the metric and the status.
Get insights like this every week
Analytics, ops strategy, and product updates. No noise.
Keep reading
How do PE operating partners get real-time visibility into portfolio company performance?
Why “value add” in private equity is mostly theater (and what would actually fix it)

How PE Firms Leverage Data for Smarter Investments
Book a discovery call
Reach out to start a two-way conversation about your industry, your performance variations across locations, and whether Scoop is the right fit for you.