
Labor cost percentage: a roll-up found 40% excess labor. Your monthly report wouldn't have.
A roll-up found 40% excess labor in a clinic before close. Why labor cost percentage hides problems in locations you own, and how to diagnose them.
Labor Cost Percentage: Why 40% Excess Labor Goes Unseen
A clinic's labor cost percentage can run far above standard for months while every monthly report shows the number, because after a roll-up finishes nobody reads each location against a standard.
One PE-backed medical aesthetics roll-up found a target clinic carrying 40% more labor than it should and made a labor reduction. The data was there all along. What was missing was someone reviewing it.
I heard this story recently from someone inside that roll-up, and I keep coming back to it. Most people would file it under good diligence. I file it under operations.
A roll-up forced someone to read one clinic, line by line, against a standard. Once the roll-up finishes, nothing forces that read again. The monthly report goes back to summarizing. The same kind of data sits unread inside every location the company already owns.
That is a location performance variance problem, and it costs margin every month nobody looks.
Clinic labor cost analysis

Target clinic labor cost
40% more labor than it should
Monthly report status
Summarizing data without reading against standard
Location performance variance
Costs margin every month nobody looks
What actually happened before close?
Nothing exotic. This roll-up integrates financially and operationally at the same time. The work starts before the acquisition closes. Once the roll-up had access to the target's systems, it read the clinic's operating metrics against its own benchmark. Labor stood out.
- The roll-up read the clinic against the benchmark. Labor was, in their words, "way out of whack."
- The roll-up sized the gap. The clinic had "literally 40% more labor than you should have"
- The roll-up made it a deal term. Labor had to come down before the acquisition took place.
The message to the target was direct:
"Your labor is so out of whack that if we did acquire this, we would require you to reduce labor before the acquisition even took place."
The reasoning was about margin. With that much labor in the building, any new revenue coming in was getting its margin compressed.
They delivered it with care. They didn't want to walk in and surprise anyone, and nobody wanted to look like the bad guys. But the number was the number.
Acquisition labor optimization process
Benchmark analysis
Size labor gap
Set deal terms
Communicate requirements
Execute reduction
Why do high labor costs hide in locations you already own?
Because a roll-up creates four conditions that a normal operating month never does. Take them away and the same 40% excess labor can go unexamined in a clinic you own for a year.
- There was a deadline: Close was coming, and the question had to be answered
- There was a named owner: Someone was accountable for reading that specific clinic
- There was a specific question: is this location operating the way our locations should?
- There was a consequence: The answer changed the terms of the roll-up
At month 14 of ownership, none of those conditions hold. No single clinic has a deadline. No one is assigned to read each location line by line. The question has shifted to "how is the portfolio doing?" Unless a location trips a threshold on the report, nobody investigates it.
High labor costs rarely arrive in one jump. They creep. A provider leaves and the schedule stays. A slow block never gets trimmed. That's the drift problem: the standard gets set, then excess labor builds one schedule at a time.
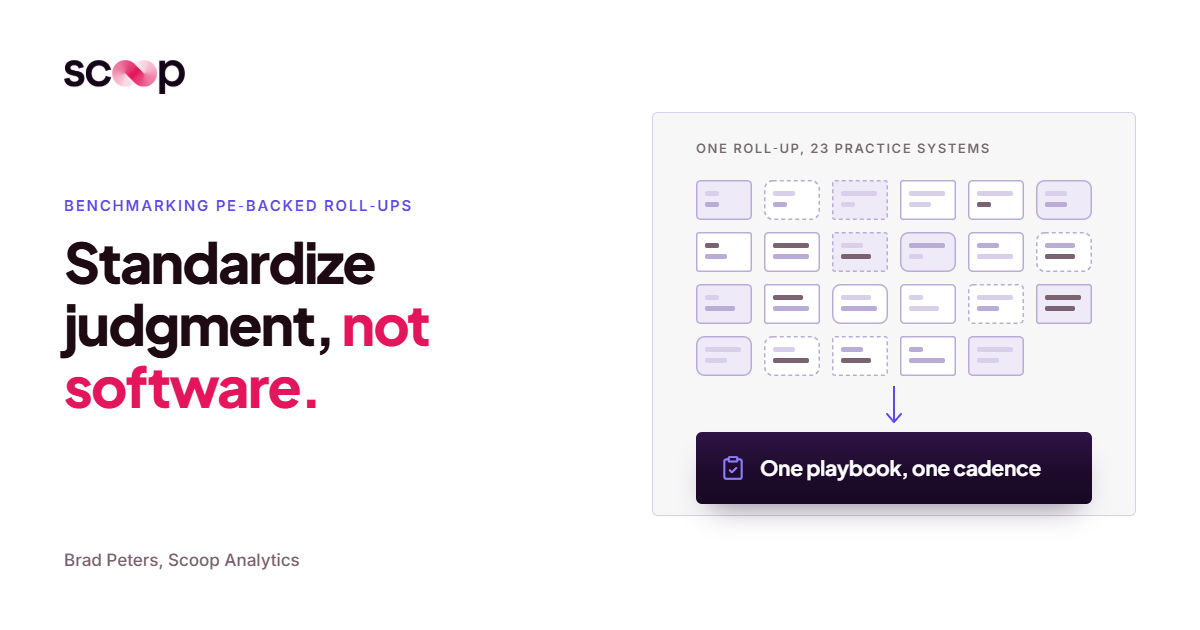
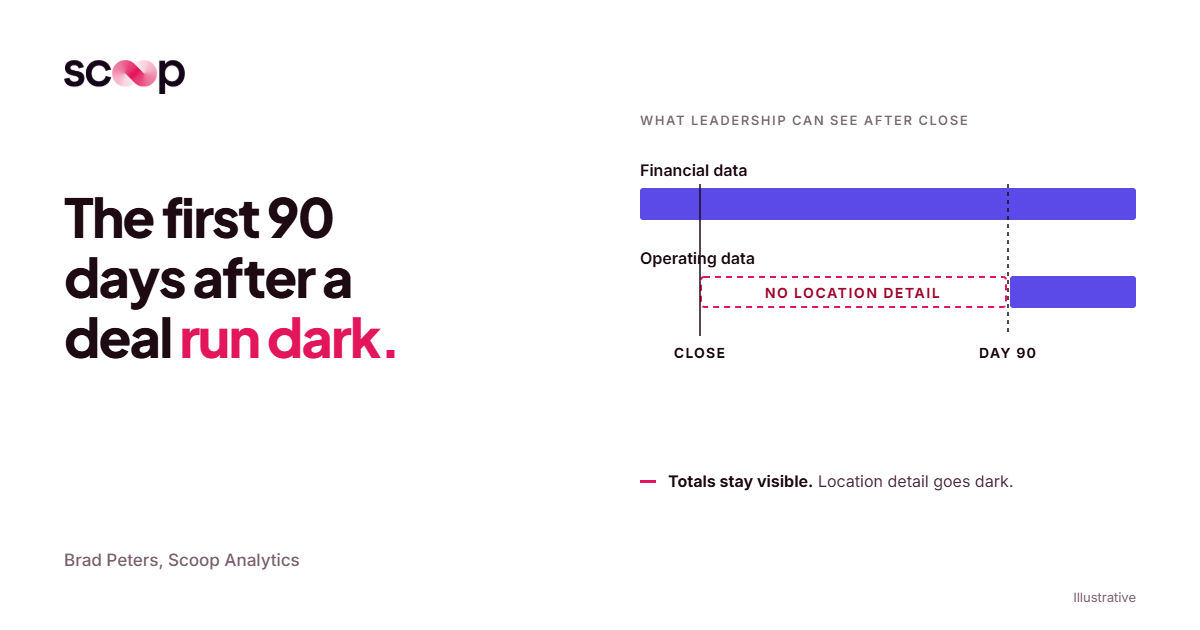
Data plumbing makes it harder. In dental, two or three practice management systems dominate, so the data comes in clean. Medical aesthetics is fragmented. This roll-up once pulled from 23 different systems. Operating metrics take roughly 90 days to map after close because every clinic names things differently, so operational visibility on a new location is weakest when it matters most.
The test is one question: if a location you already own drifted to 40% excess labor over 18 months, which document would tell you?
Why labor costs hide
What does labor cost percentage actually tell you?
Less than most people think. Labor cost percentage is total labor cost divided by revenue, times 100. Load it fully: wages, overtime, commissions, payroll taxes, benefits, and contract labor. Leave benefits out and the number is wrong. Bureau of Labor Statistics data shows wages are only 70% of private-industry compensation costs, and benefits carry the other 30%.
The same percentage can have different causes. Take three clinics, each showing labor at 46% of revenue against a company standard of 38% (illustrative numbers).
- At Clinic A, revenue fell and staffing didn't. A lead injector left and bookings dropped, while the schedule stayed the same. The data establishes that revenue is down and hours are flat. It points to a demand problem, and overstaffing is the less likely cause. The manager should check rebooking rates and the departed provider's client list before touching the schedule.
- At Clinic B, the schedule is the problem. Revenue is steady, but two providers are booked on Tuesday and Wednesday mornings that run half empty. The data establishes low utilization in specific blocks. It points to scheduled overstaffing. The manager should check booked hours against paid hours by day and daypart.
- At Clinic C, the service mix shifted. Injectables share fell, and lower-ticket, longer-appointment treatments grew. Labor hours per dollar of revenue rose even with a full book. The data establishes a mix change. It points to a pricing or menu question. The manager should check revenue per provider hour by treatment category.
A summary report flags all three yellow. The right response is different in each one. That's diagnostic analytics in its plainest form: the useful question is why the number happened.
The range a clinic can fall within is wide. Zenoti's benchmark data puts the gap between median and top-decile med spas at 42 percentage points of staff utilization. The only way to know where a clinic sits in that range is to benchmark locations against comparable sites every period. Once at close is too rare.
Why labor cost percentage varies
Revenue
- Revenue fell and staffing didn’t
- Bookings dropped; schedule stayed same
Utilization
- Two providers booked on half‑empty mornings
- Low utilization in specific blocks
Service mix
- Injectables share fell
- Lower‑ticket, longer‑appointment treatments grew
How do you reduce labor costs without cutting the wrong thing?
Diagnose first. Every instinct in a cost review says cut hours. At Clinic A, that's exactly wrong: you'd deepen the revenue problem you actually have. The order of checks matters, because each one rules something out.
- Check revenue. Did sales fall while paid hours held flat?
- Check the schedule. Where do booked hours fall short of paid hours, by day and daypart?
- Check the mix. Has revenue per provider hour moved by service category?
- Check overtime. Are hours landing at premium rates because of coverage gaps?
None of those checks is hard. The hard part is running them on every location, every cycle, instead of on the three that happened to cross a threshold. The pattern shows up outside clinics too. In a labor cost analysis for a hotel, cost per occupied room rose from $26 to $34 because of a scheduling pattern on slow days. The stores costing you margin are usually the ones your review never gets to.
Diagnosing labor costs
Did sales fall while paid hours held flat?
Where do booked hours fall short of paid hours, by day and daypart?
Has revenue per provider hour moved by service category?
Are hours landing at premium rates because of coverage gaps?
Why won't a better monthly report fix this?
Because the gap is in who reviews each location. A monthly operating report summarizes performance for the people above the business. It was never built to investigate each location.
In a PE-backed roll-up, the MOR goes to the fund every month, and the fund rolls it up again for its LPs. Aleph's guide to portfolio reporting describes sponsors expecting a monthly management pack with variance commentary on a tight clock. Most of these reports run on green, yellow, and red, which is the red/yellow/green trap: a color shows what happened and says nothing about why. My contact inside the roll-up put it better than I can:
"It's not just about whether they performed or didn't perform. Let's talk about why."
There was another line I wrote down: "The cut of the numbers is everything." Portfolio companies aren't doing anything funny with the numbers. But every report is a choice about how to slice them, and the natural slice is the one that shows the business in its best light.
Redesign the MOR all you want. These things stay true:
- Reports aggregate: A clinic with 40% excess labor barely moves a 30-clinic portfolio average.
- Thresholds catch outliers and miss drift: A clinic that slides two points a quarter never crosses a line in any single month.
- The drilling is the expensive part: When we investigate a single store, we typically run 50 to 70 individual drill-downs, each chosen based on what the last one found. Across 30 clinics, that's 1,500 to 2,100 lines of inquiry a month. No one does that alongside a day job.
- One central reader sees macro trends: Even a strong one isn't looking at the individual operating deviations of each location.
Why a better monthly report won’t fix this
What should be reviewing every location, every cycle?
The location-level review from diligence, run permanently. The roll-up that caught the 40% knew what "out of whack" meant for a clinic like that. That judgment is the asset. The job is to write it down and run the location-level review on every location, every month, including the ones that aren't being acquired.
- Write a standard for what good labor looks like for this clinic type, size, and service mix.
- Set a diagnostic path that says which questions come next when labor is high, and in which order.
- Run the location-level review on every location every month, whether a threshold has been crossed or not.
- Produce an output that says what moved, what the evidence supports, and what the manager should check.
Scoop does this work. Scoop sits with your operators and captures the tribal knowledge behind how they read the numbers. I describe it as a tape recorder: if we took a tape recorder and recorded everything you thought as you looked at a clinic's numbers, we can stick that into the system so it does the same review on your behalf. I've heard the result described this way:
"A mini version of that person in a box, scanning and analyzing every week on their behalf."
Then the location-level review runs across every location, every cycle. A report arrives with what changed, the likely driver, and what to check next. That's how Scoop works, and it's what I think AI performance management should mean. Your best operator's review runs on every location without anyone asking for it.
I can't say a system would have caught that exact clinic on day one. My contact inside that roll-up was blunt about where most companies stand:
"A lot of organizations don't know how poorly they're doing this. Or don't know what good looks like."
Here's the question I'd ask any operating partner. What is reviewing every location, every cycle, the way someone reviewed that target clinic before close?
Built for the businesses that run everywhere at once.
Scoop exists to bring best-in-class operational diagnostics to every distributed business, not just the ones big enough to staff a team for it. Meet the people building it.
- Operator-first by design
- Built for distributed teams
- Diagnostics, not dashboards
Frequently asked questions
What is labor cost percentage and how do you calculate it?
Labor cost percentage is total labor cost divided by revenue for the same period, times 100. Use fully loaded labor: wages, overtime, commissions, payroll taxes, benefits, and contract labor. Calculate it per location as well as in total, and read it next to your other operational performance metrics.
Is labor cost percentage enough to diagnose overstaffing?
No. It tells you labor is high relative to revenue. It doesn't tell you why. That's one of the core diagnostic analytics questions. Check these before acting:
- Did revenue fall while hours stayed flat?
- Are booked hours well below paid hours in specific blocks?
- Has the service mix shifted toward longer, lower-ticket appointments?
How do you reduce labor costs without hurting revenue?
Find the cause first. If revenue fell, cutting hours can make it worse. If the schedule is the issue, rebuild the empty blocks. If the mix shifted, look at pricing and the menu. For PE-backed operators the goal is no EBITDA left behind at any location, which means the same diagnosis runs everywhere.
Does location-level review replace the MOR or the BI team?
No. The MOR still does its job for the fund and the LPs, and the BI stack still holds the data. Scoop sits on top of the BI stack you already run and adds the interpretation and next step for each location. It's live in weeks, with no data migration.
Get insights like this every week
Analytics, ops strategy, and product updates. No noise.
Keep reading
Labor cost percentage: a roll-up found 40% excess labor. Your monthly report wouldn't have.
How do PE-backed roll-ups benchmark location performance when every clinic has a different tech stack?
What happens to operational visibility in the 90 days after an acquisition?
Book a discovery call
Reach out to start a two-way conversation about your industry, your performance variations across locations, and whether Scoop is the right fit for you.