
Decision velocity: the new metric for 2027
Decision velocity is how fast your organization moves from a signal in the data to a corrective action at the location where the problem lives.
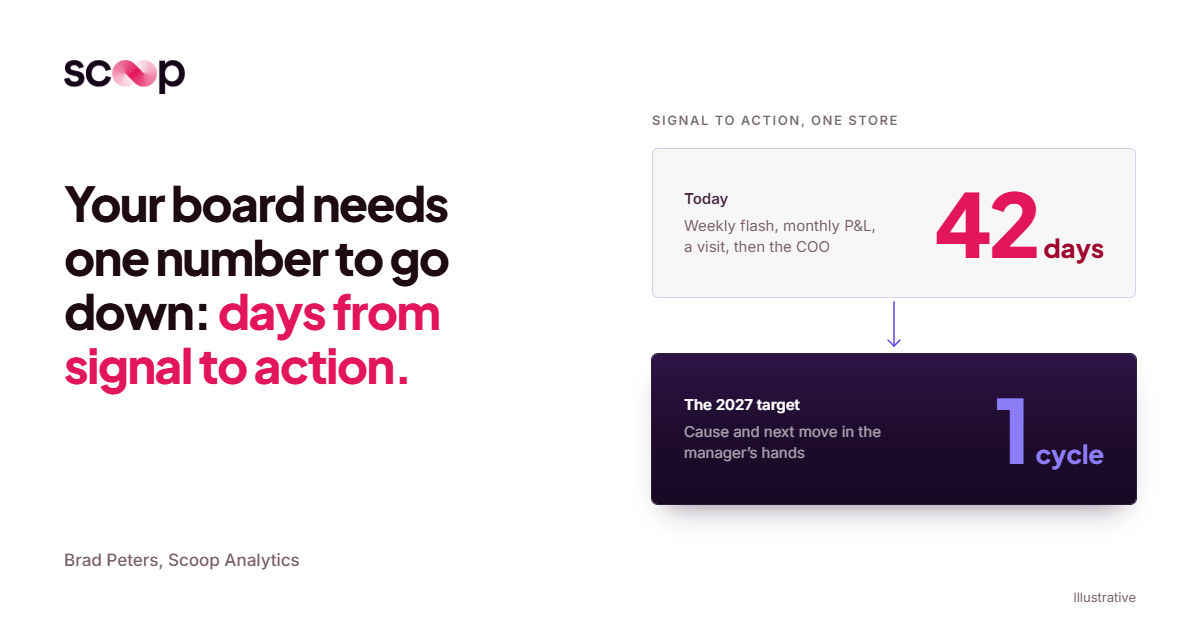
For 2027 it is the AI metric worth funding, because you can measure it in days, it shows up in location-level P&Ls, and it delivers more return with less effort than workflow automation ever did.
Let me start where most AI pieces don't: with the skepticism.
If you approved an AI or automation project in the last two years and still can't tell your board what it returned, you're not behind. You're typical.
MIT's NANDA initiative interviewed 150 leaders, surveyed 350 employees and analyzed 300 public deployments. Its finding: 95% of generative AI pilots at large companies produced no measurable P&L impact. Most of the operators I talk to didn't need the study. They lived it.
My co-founder Neil Shepherd put the alternative better than I can:
"For the mid market that's the thing. Decision velocity is where AI can add more value with less effort, compared to workflow automations."Neil Shepherd, co-founder, Scoop Analytics
I agree with him. Neil has already made the broader case for AI decision management. This is the operating version: what decision velocity is, how to measure it, and why a 40-unit restaurant group is better positioned to win at it than a Fortune 500.
Why did workflow automation fail to pay off?
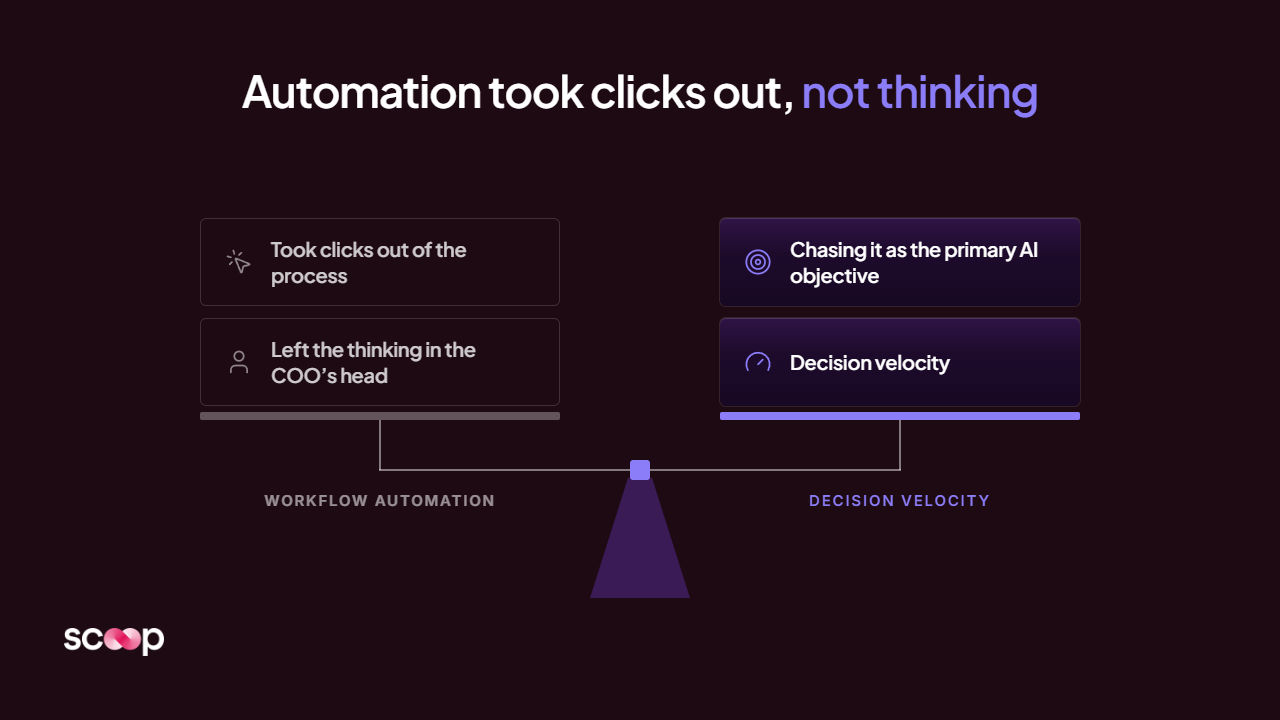
Because it automated the easy part of running locations and left the expensive part, judgment, exactly where it was.
The numbers are not subtle:
- Gartner expects more than 40% of agentic AI projects to be canceled by the end of 2027, citing rising costs, unclear business value and weak risk controls.
- The same research estimates only about 130 of the thousands of vendors selling "agentic" AI are the real thing. The rest are relabeled chatbots and RPA.
- MIT traced most pilot failures to a learning gap: tools that never adapt to how the business actually runs.
A PE operating partner with a multi-unit restaurant and hospitality portfolio told us the CIOs he works with are pulling back on workflow automation because "the ROI was never really well established." What they're chasing instead, he said, is decision velocity, as their primary AI objective for the next 12 to 18 months.
I've watched this movie before. In two decades of building BI platforms, I saw half of all analytics projects fail. It's not the technology. It's that the people implementing don't really understand the business problem.
Workflow automation repeated that mistake at a new price point. Here's what it actually touched in a typical restaurant group:
- Invoice capture and AP routing
- Schedule publishing and shift-swap approvals
- Order guides and par-level reorders
All useful. None of it tells a general manager why her Thursday dinner labor is running four points hot. That's a judgment call, and decision automation was never built to make it.
When a system makes a call your best GM wouldn't have made, nobody can ask it why. That's the quiet cost of black-box AI.
Automation took clicks out of the process. It left the thinking in the COO's head.
What is decision velocity in plain operating terms?
Decision velocity is the elapsed time between a number going wrong at a location and someone at that location doing something different about it. Not the time to build a report. The time to change a schedule.
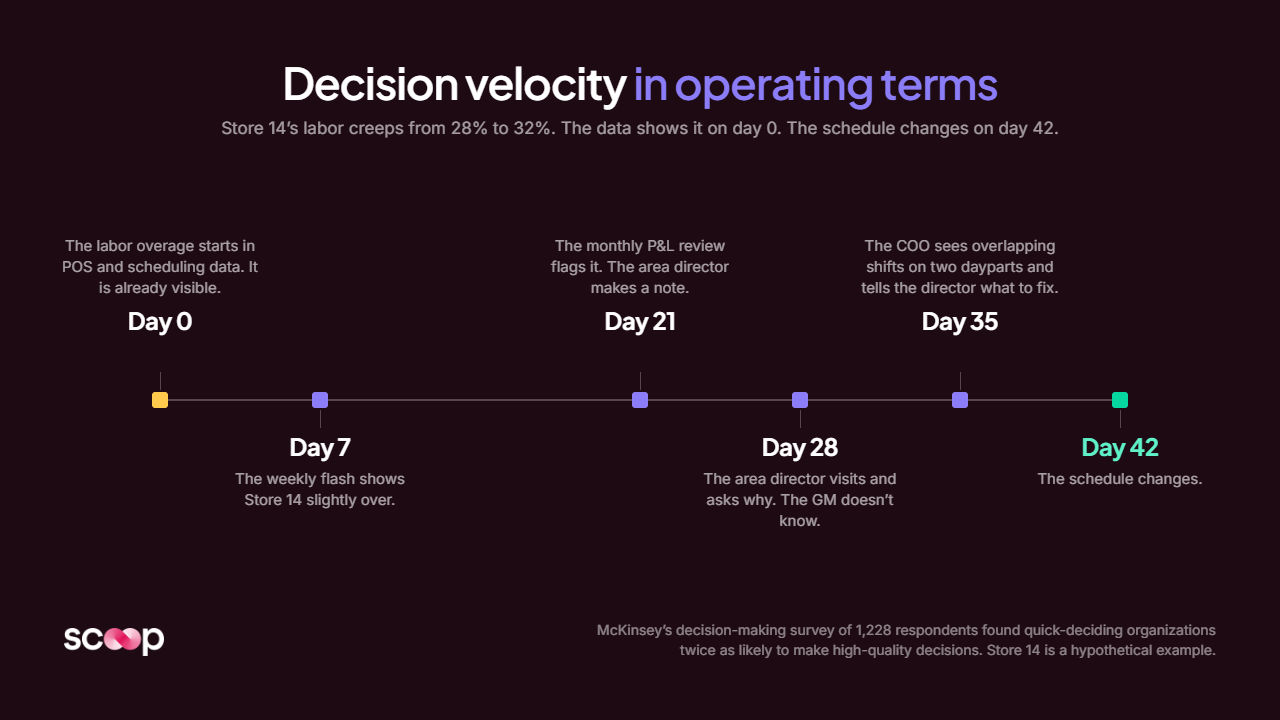
Here's the clock at a hypothetical 40-unit group. Store 14 does $2 million in annual sales, and its labor cost creeps from a 28% target to 32%:
- Day 0. The overage starts in the POS and scheduling data. It's already visible.
- Day 7. The weekly flash shows Store 14 slightly over. It's one row out of 40.
- Day 21. The monthly P&L review flags it. The area director makes a note.
- Day 28. The area director visits and asks why. The GM, eight months in the seat, doesn't know.
- Day 35. The COO looks for ten minutes, sees overlapping shifts on two dayparts, and tells the director what to fix.
- Day 42. The schedule changes.
Six weeks. Four points of labor on roughly $38,500 in weekly sales is about $1,540 a week, or more than $9,000 before anyone touched the schedule. At one store.
The data was there on day zero. The bottleneck was never data. It was the gap between data and decision.
Break the clock into four intervals and you can see where the days go:
- Time to detect: data lands to someone noticing
- Time to diagnose: noticing to a cause a GM can act on
- Time to decide: cause to a specific instruction
- Time to act: instruction to a changed schedule, order or price at the unit
Most AI budgets went to detection: alerts, anomaly flags, prettier dashboards. In the clock above, the expensive days sit in diagnosis and decision. That's the difference between monitoring and an investigation that tells you why.
Speed doesn't cost you quality, either. McKinsey's decision-making survey of 1,228 respondents found that organizations that decide quickly are twice as likely to make high-quality decisions.
Why does decision velocity matter most at the unit level?
Because the slowest stretch of the clock is the last mile: a frontline manager who sees the number and doesn't know what it means or what to do about it.
Neil described the pattern he hears from multi-location COOs:
"a frontline manager who sees the number and doesn’t know what it means” is now “a frontline manager who sees the number but hasn’t had the years it takes to know what it means."
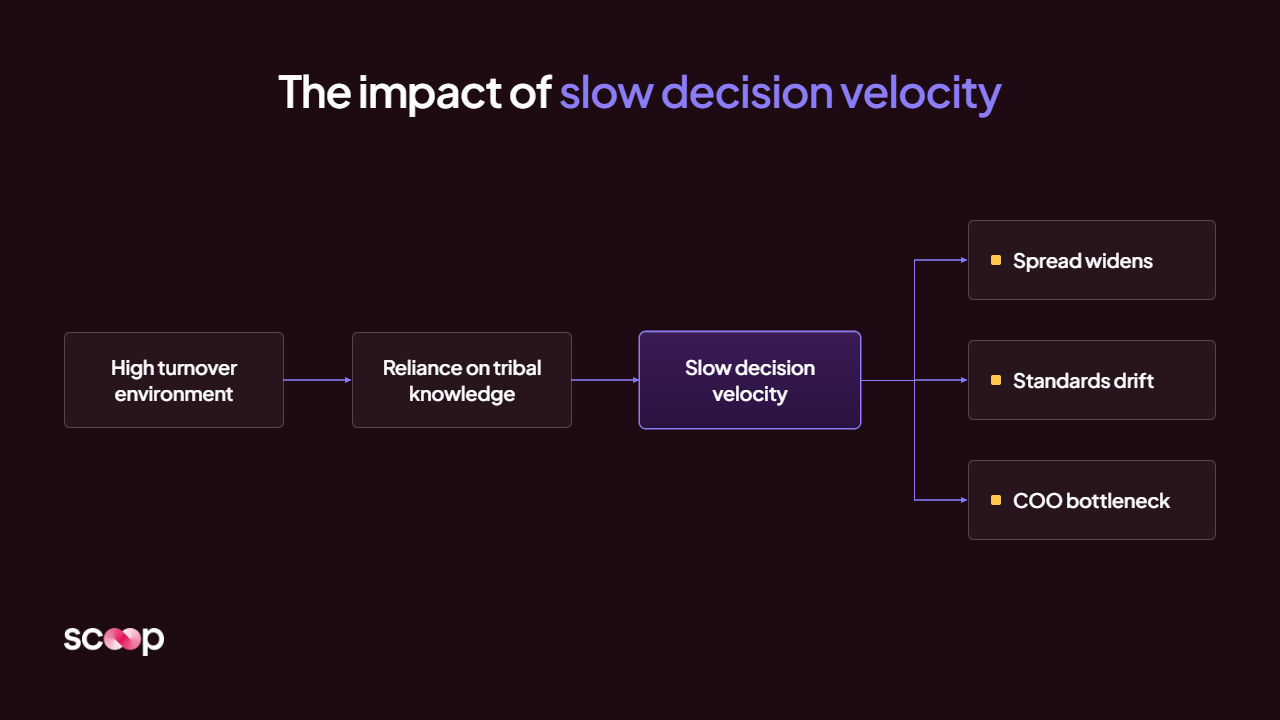
That variation isn't a training failure. It's math. Black Box Intelligence puts limited-service hourly turnover at 110% and manager turnover in the mid-40s % through 2025. Full service runs about 92% hourly and 35% for managers. In any given year, a big share of your GMs are learning the job while running it.
Meanwhile, the judgment that would fix Store 14 in ten minutes lives in one or two people. At the largest pawn chain in the United States, the COO had 27 years in the industry. He knew the business like the back of his hand. The people on the front lines didn't. The CEO told me his single biggest business risk was losing that COO.
That's tribal knowledge in its purest form, and it's why a slow clock costs more than the overage itself:
- Spread widens. Your top quartile pulls away from your bottom quartile, and the board reads it as a people problem.
- Standards drift. An independent hotel management founder described it to me in two words: "things unravel." That's the drift problem, and it compounds every cycle nobody catches it.
- The COO becomes the queue. Every diagnosis waits for the one person who can make it.
The pawn chain shows how expensive the lag gets. Its operators know a pattern they call the death spiral: lending gets aggressive, inventory builds, discounting starts, margins fall, the store overcorrects, and revenue craters four to six months later. The early signals show up long before the crater.
Decision velocity is the size of that window.
Why are mid-market multi-location operators better positioned to win?
Because decision velocity runs on judgment, not IT departments, and the mid-market has a shorter path from the person with the judgment to the person with the problem.
Enterprise CIOs are pivoting to this metric. Mid-market operators can actually hit it first:
- One playbook. At 20 to 100 locations, there's usually one COO or VP of Operations whose read of the numbers is the standard. At 1,000 stores, regional playbooks compete.
- Fewer layers. At the largest pawn chain in the United States, a store's results roll up through district, area, region and division before they reach the top. A 40-unit group has one or two layers between the COO and a GM.
- A simpler stack. POS, scheduling, inventory, accounting and a BI tool. Not 40 systems and a two-year data roadmap.
- No build required. MIT found that AI tools bought from specialized vendors succeed about 67% of the time, while internal builds succeed about a third as often. You don't need an AI lab to compete here.
The pressure is the same at every size. A VP of quality at a large home-furnishings retailer gave me the whole brief in six words:
"More from less. Nobody has time."
His product development cycles went from 18 months to three or four. Teams are flat.
Under that pressure, restaurant business intelligence should be judged by days saved, not hours automated. The same goes for franchise performance management, where a franchisor needs every franchisee's read to be as good as the best one's. And days saved is the number a sponsor behind private equity rollups will actually underwrite.
How do you measure decision velocity before you buy anything?
Reconstruct the clock on your last three adverse trends. If you can't date the moments, that's your first finding.
- Pick three problems. Location-level, from the last two quarters: a labor overage, a food cost spike, a comp-sales slide.
- Date four moments for each. When the data first showed it, when someone flagged it, when someone named the cause, when the unit changed something.
- Add up the days. That's your baseline signal-to-action time.
- Count coverage. How many of your locations got a real review from your best operator last cycle? Not a glance at the flash. A review.
- Measure spread. The gap between your top and bottom quartile on the KPI that matters most.
Those numbers are a board-ready way to measure operational performance on an AI investment. They also give you a clean before-and-after against what enterprise CIOs tried first:
Expect most decisions to stay human. Gartner forecasts that at least 15% of day-to-day work decisions will be made autonomously by 2028, up from zero in 2024. That still leaves the large majority with a person.
The question is how fast that person gets the right read.
What should operators shoot for in 2027, and where does Scoop fit?
Shoot for one cycle. Every location gets your best operator's read, with the cause and the next move in the manager's hands before the next cycle's numbers land.
Concretely, that means four targets:
- Full coverage. Every location reviewed every cycle, not just the ten that got loud.
- Same-cycle diagnosis. The cause is named in the cycle the trend appears.
- Follow-through. Last cycle's actions get checked this cycle: done, watching or escalate.
- Shrinking spread. The gap between top and bottom quartile narrows quarter over quarter.
That's the problem we're building Scoop around, and I'll be straight about where it stands.
Capture starts with a question I ask every COO: if I took a tape recorder and recorded everything you thought as you looked at your BI reports, could we stick that into the system so it does that on your behalf? At the pawn chain, we spent a week in Houston with the COO and the regional and district managers, walking through Power BI in 11 stores. Those recordings became the logic Scoop runs.
From there, how Scoop works is simple to describe. It screens every location on a schedule, spawns an investigation when a screen trips, runs 15 to 30 probes on that store, and synthesizes what it finds the way your COO would. A report arrives. Nobody logs in. It sits on top of your BI stack instead of replacing it.
Detection and diagnosis are where the first days come out of the clock. The last mile, turning a diagnosis into the exact action a GM eight months into the job should take, is the part we're still sharpening with customers. I'd rather tell you that than sell you a solved problem.
That's what I mean by AI performance management. It doesn't automate judgment. It automates the legwork that prevents judgment from happening.
Your board doesn't need another automation forecast. It needs one number that went down: days from signal to action.
Start counting.
Built for the businesses that run everywhere at once.
Scoop exists to bring best-in-class operational diagnostics to every distributed business, not just the ones big enough to staff a team for it. Meet the people building it.
- Operator-first by design
- Built for distributed teams
- Diagnostics, not dashboards
Frequently asked questions about decision velocity metric
What is decision velocity?
Decision velocity is the time it takes an organization to move from a signal in its data to a corrective action at the location where the problem lives. It's measured in days across four intervals: detect, diagnose, decide and act. It takes the idea behind decision intelligence down to the unit level.
How is decision velocity different from workflow automation?
Workflow automation removes manual steps from a process and is measured in hours saved. Decision velocity shortens the time to a better human decision and is measured in days from signal to action. One removes clicks. The other is decision augmentation: the system does the analysis, and your managers make the call faster.
How do you measure decision velocity in a multi-location business?
Reconstruct the timeline on recent location-level problems and track four numbers:
- Signal-to-action days, broken into detect, diagnose, decide and act
- Coverage: the share of locations your best judgment reviews each cycle
- Spread: the gap between top- and bottom-quartile locations
- Follow-through: the share of last cycle's actions confirmed this cycle
Most operational analytics programs only track the first interval.
Do you need to replace your BI tools to improve decision velocity?
No. The data is usually already in your POS, scheduling and BI tools. What's missing is the interpretation layer on top. A Scoop implementation connects to the data you have and codifies your best operator's playbook, with a working pilot in weeks.
Why is decision velocity a 2027 priority?
Because the first wave of AI spending is being audited. Boards want proof in the P&L, and operators can't add headcount. Decision velocity is measurable now, needs no process redesign, and shows up in location-level lines like labor and food cost, the same lines food and beverage performance management is built to watch.
Get insights like this every week
Analytics, ops strategy, and product updates. No noise.
Keep reading


Book a discovery call
Reach out to start a two-way conversation about your industry, your performance variations across locations, and whether Scoop is the right fit for you.