
See why every portfolio company moved, and what to do next.
Scoop brings each company’s data into one standard, investigates every location the way your best operator would, sends each manager a short action plan, and tracks whether it worked. Your monthly operating report1 comes out of that work, with the reason behind every number.
1 Funds call it different things: the monthly operating report, monthly reporting package, management pack, flash report or KPI pack. We mean the report each portfolio company sends its fund every month.
Co-B is behind plan at 19 of 64 hospitals. All 19 trace back to one cause.
- 471 locations investigated
- Visits split from invoice
- Traced to the fee schedule
Visits held, but average invoice fell at those 19. All were acquired this year and still bill on their old fee schedule.
Sample review. Companies and figures are illustrative.
Load the 2026 fee schedule at the 19 hospitals.
8 of 19 done. The other 11 are flagged to the COO.
None of it works without clean data. Most portfolios don’t have it.
Operating partners say the same thing in survey after survey: getting each company's data into one shape is the hard part.
of PE operating partners name fragmented systems and the lack of a clean data layer as a barrier. It ranked first of seven.
Accordion, PE AI Adoption Benchmark, May 2026 (150 operating partners)portfolio companies arrive with data that isn't ready. A third need 12 months or more of cleanup.
Accordion, PE AI Adoption Benchmark, May 2026of portfolio companies build a report or deck by hand to share data with their PE firm.
PwC, Next in Private Equity survey of portfolio companies, 2022Why reporting across a rollup rarely gets done well
Many systems of record
Finance, point of sale, practice management, workforce scheduling and inventory each hold part of the picture, and rarely in one place.
Many vendors for each system
Every acquisition brings its own products. One rollup we spoke with had 23 different practice management systems at once.
Different setups and definitions
Each company configures its systems its own way, so revenue, visits or labor hours mean something slightly different in each.
Locations and people keep changing
Sites open and close, managers move, and each system names them differently. The mapping breaks quietly unless someone keeps it current.
In theory each company can fix this itself and end up with one clean data warehouse. In practice it is so much work that it rarely gets finished, and smaller funds don’t have the data team to lend out.
Scoop does the mapping. Your team handles the exceptions.
Scoop’s AI reads each company’s systems and maps their fields, metric definitions and location names to one standard. Matches it is confident about are applied automatically.
Anything below that bar goes to a person to confirm, so the report never quietly uses a wrong mapping. Each new acquisition goes through the same steps.
68 of 71 clinics matched across three systems. 3 go to a person.
Sample mapping. Companies and figures are illustrative.
- “Net production”Net revenue
- “Provider hours”Clinical labor hours
Stays right as the portfolio changes.
Locations open and close, managers move, and systems get swapped out mid-hold. Scoop rechecks its mappings every cycle and sends anything new or unclear to a person, instead of letting the report drift.
Everything else stayed in sync. 3 changes need a person.
- New clinic
Gilbert, AZ appears in the practice system. It isn't in finance yet.
Add clinicNot now - Manager change
One clinic manager is listed at both Chandler and Mesa in scheduling.
ReviewNot now - Possible closure
Phoenix Central has recorded no visits for 30 days.
Mark closedNot now
Sample queue. Companies and figures are illustrative.
The fix applies to every report from this cycle on, for every role.
How it works for a fund
Five steps, the same for every company in the portfolio. See the full implementation process.
- 1
Design the report with you, once.
We agree the metrics, definitions and ratings with your operating team, so every company reports the same way. - 2
Connect each company's systems.
Read-only access to the systems they already run. No migration, and flat files work too. - 3
Normalize the data.
Scoop's AI maps fields, definitions and location names to your standard. Your team only confirms what it can't resolve. - 4
Deliver it every month.
A fund view, a report for each company, and a briefing for every location manager. - 5
Keep it current.
New acquisitions, openings, closures and manager moves are picked up each cycle, with anything unclear sent to a person.
It investigates, recommends and tracks.
Every cycle, Scoop runs the investigation your best operating partner would run if they had time for every location: dozens of checks per location, following the numbers to a cause.
It turns what it finds into a short action plan with an owner for each company and location, then checks the next cycle whether the action was taken and whether the number moved.
Each company tends to cut its numbers in the best light. With one standard, the plain result shows, and the review starts at the cause instead of the argument.
Two of four portfolio companies are ahead of EBITDA plan. The two behind discount 7 to 9% below list in the field.
- 48 locations screened
- One KPI set
- Price checked vs list
The discounting hides in gross margin, not top-line comps. Both laggards run a monthly operating review; the two outperformers run weekly. Attention goes first to Co‑01.
Sample report. Stores and figures are illustrative.
EBITDA margin is 3.1 points below plan. Realized price averages 8.5% under list across its 16 locations.
Run a pricing audit and set discount approval limits by role.
Nothing gets missed, everything gets acted on.
Portfolio companies get more out of Scoop than a report for their fund. Here's what changes for the people running them.
For the CEO and operating team
Every location looked at, every month
Scoop investigates every location each cycle, not just the few someone had time for, so small problems surface before they reach EBITDA.
A plan for each manager
Each location manager gets the reason their numbers moved and a short list of actions with an owner and a due date.
Follow-through you can see
Next cycle shows which actions were taken and whether the number moved, so the operating review starts with what worked.
The weakest locations catch up
Every location and provider sees where it stands against its peers and what the best ones do differently.
For the CFO and finance team
The monthly report builds itself
The report for your fund fills from the systems you already run, in the format the fund asked for. Finance stops rebuilding it every month.
One set of numbers with the fund
The same definitions on both sides, so board and operating reviews start at decisions instead of reconciling figures.
Add-ons on the same standard in weeks
Each acquisition is mapped to your definitions during integration, and peer benchmarks flag where a target is out of line before close.
A record the next buyer can check
Every action, owner and result is kept cycle by cycle, so the value creation work shows up as evidence in diligence.
Built for lean portfolio teams.
Large funds can staff a data team for every platform. Most can’t, and their portfolio companies feel it.
- Funds with roughly 5 to 40 portfolio companies and a small operating team
- Rollups that have made a string of acquisitions, each with its own systems
- Platforms with many small locations, where there's little budget for a data team at each one
Related reading
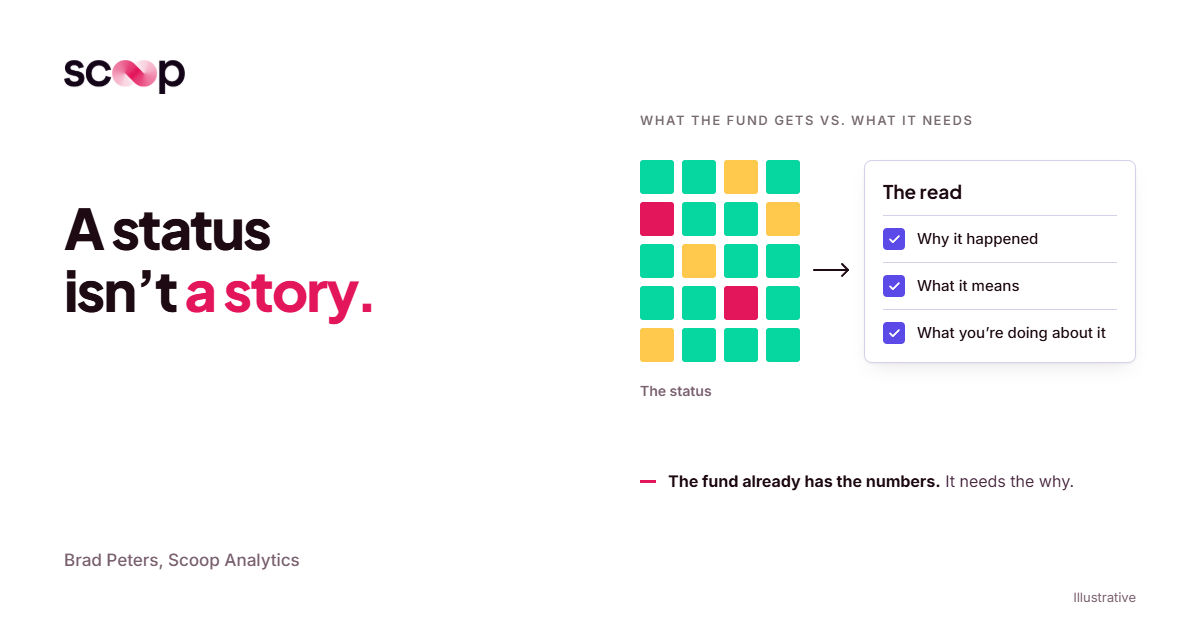
The Red/Yellow/Green Trap: Why PE Operating Reports Need a Story, Not a Status

How do PE operating partners get real-time visibility into portfolio company performance?
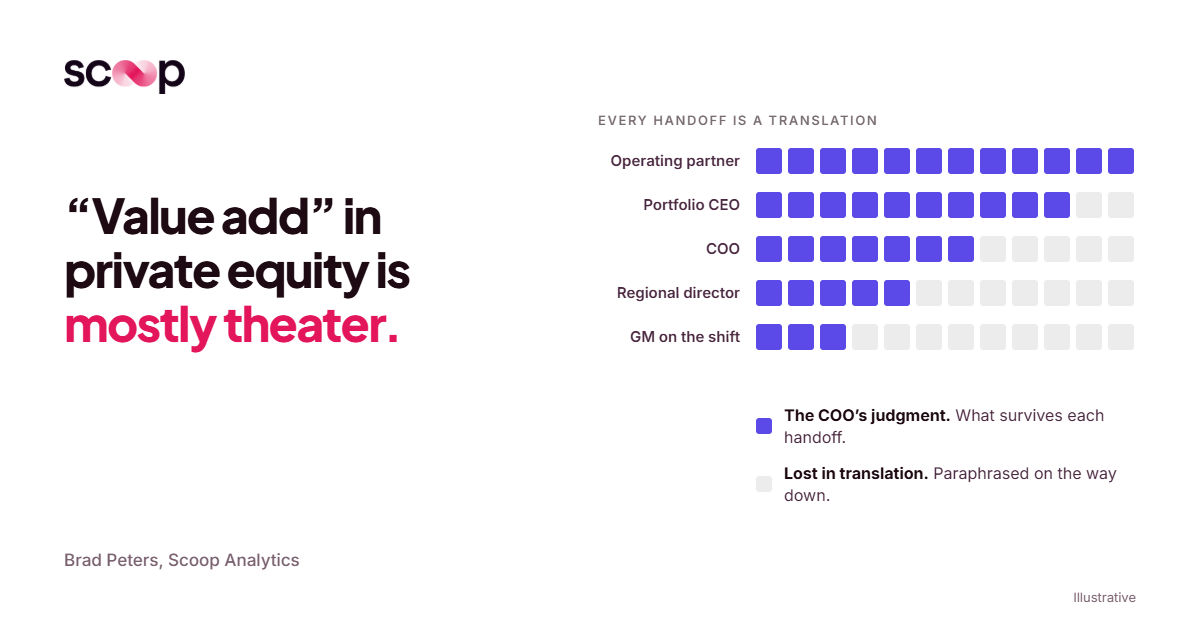
Why “value add” in private equity is mostly theater (and what would actually fix it)
Book a discovery call
Reach out to start a two-way conversation about your industry, your performance variations across locations, and whether Scoop is the right fit for you.