
What a read on every unit looks like
One report for one unit, then the same read for every unit, with actions and a check on whether they worked. Here is what a read on every unit actually looks like, and why it is not a dashboard.
When I describe what we built, people nod. When I show them one report, they get it. So here's the report.
It's a sample from a retail chain, with the store and the numbers made up, but it has the same shape as the real thing. You can open it here.
The store is just the example. Read "clinic," "customer account," "branch" or "member" wherever it says store, because the report works the same way for anything a business has a lot of and compares.
One unit
It lives in our reporting portal: a summary brief at the top, and a brief for every unit underneath. This one is the brief for Store 2053. It opens with one paragraph:
Net sales at Store 2053 fell 8.4% YoY to $312.4K as transactions fell 11.2% to 7,248, the steepest drop of the 12 stores in SE2. Avg ticket rose 3.2% to $43.10 and kept the gap from being wider. Footwear sell-through is 41% against a 56% district median, with 158 days of Footwear on hand. Footwear sell-through is the leading opportunity for this visit.
That's the whole point in four sentences. A manager can read it in two minutes.
Underneath, it explains why: what's holding the number up, how long the problem has been building, and whether it's this unit or everyone.
The actions are the point
Most analytics stops at the finding. This keeps going.
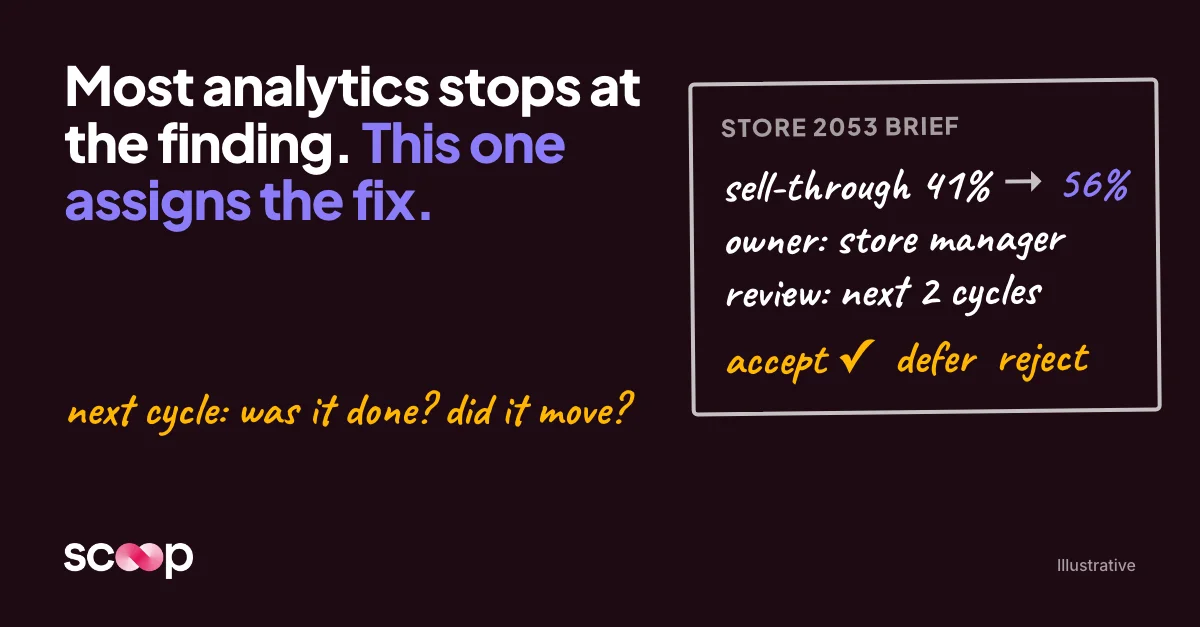
The brief recommends three actions. Each one is specific and sized to what this manager actually controls: walk the footwear wall with the category lead every Monday and pull anything past 120 days. Each has an owner, a baseline, a target and a review date: footwear sell-through from 41% toward the 56% district median, reviewed over the next two cycles, owned by the store manager.
Then the people closest to the unit decide. They can accept the action, defer it, reject it or accept it with changes. The report recommends. The team decides.
When the manager accepts, that's recorded. The manager and the person they report to are now looking at the same short list of commitments, with the same numbers attached.
And then it checks
Here's the part I care about most. Next cycle, the brief doesn't start from scratch. It shows what changed since the last report, which actions were taken, and whether the number moved. Anything still open carries forward. Over time, that record shows which fixes actually work.
That's the loop: what was recommended, what was done, and whether it worked. Every cycle, for every unit. A dashboard can't tell you whether last month's decision helped. This can.
Where the judgment comes from
One line in the brief matters more than the rest: "Playbook rule fired: Footwear aging. Sell-through under 45% for 2 cycles."
That rule didn't come from a model. It came from the people who run that business. Somebody who has walked a lot of footwear walls knows that one bad cycle is noise and two is a problem. That's written down, and it gets applied to every unit the same way.
That's the difference from a dashboard. A dashboard shows everyone the same numbers and leaves the reading to whoever has time. This does the reading, the way the best person in the company would, and writes it down.
Every unit
Now do that for every unit. The summary brief for the same period screened all 12 units, ran more than 40 checks on each one against the client's own playbook, and came back with 13 proposed actions. Most units don't need much. The few that do get it, each on its own path.
That's the part no team can do by hand. A good manager can give this kind of read to three or four units a week. Everyone else gets a dashboard.
Think about the clients you already build for. A physical therapy group with 40 clinics, or a vet group with 200. A manufacturer with a few thousand customer accounts. A credit union with 30 branches. An association with 20,000 members up for renewal. In every one of those, the people who have to act on the numbers aren't analysts. A clinic director's job is patients and staff, not reading a revenue report, so the reading gets done halfway or not at all.
The brief would say different things for each. The shape is the same: what changed, why, what to do this cycle, and whether last cycle's action worked.
Why I'm showing this to BI firms
Most of your clients already have the data, and most already have dashboards your team built. What almost none of them have is this report, for every unit, every cycle.
Which of your clients has a list like that, that nobody ever gets all the way through?
Get insights like this every week
Analytics, ops strategy, and product updates. No noise.



Book a discovery call
Reach out to start a two-way conversation about your industry, your performance variations across locations, and whether Scoop is the right fit for you.