
How Much Does Location Performance Variance Cost Multi-Location Operators?
Location performance variance costs operators margin points at weak sites. Learn how to size the gap and why most locations never get a real review.
How much does location performance variance cost operators?
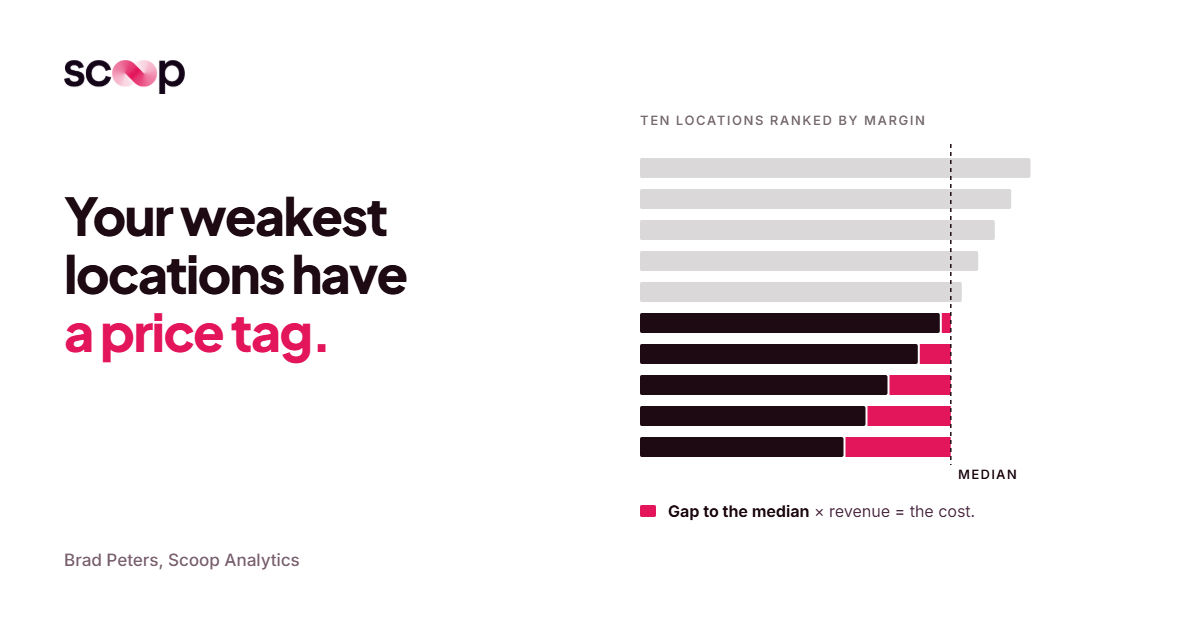
Location performance variance usually costs a multi-location operator several margin points at its weakest locations. You can size it with a directional estimate: take each location's gap to the median and multiply it by that location's revenue. The cost rarely comes from missing data. It comes from uneven review, because only a few locations get a real investigation each cycle.
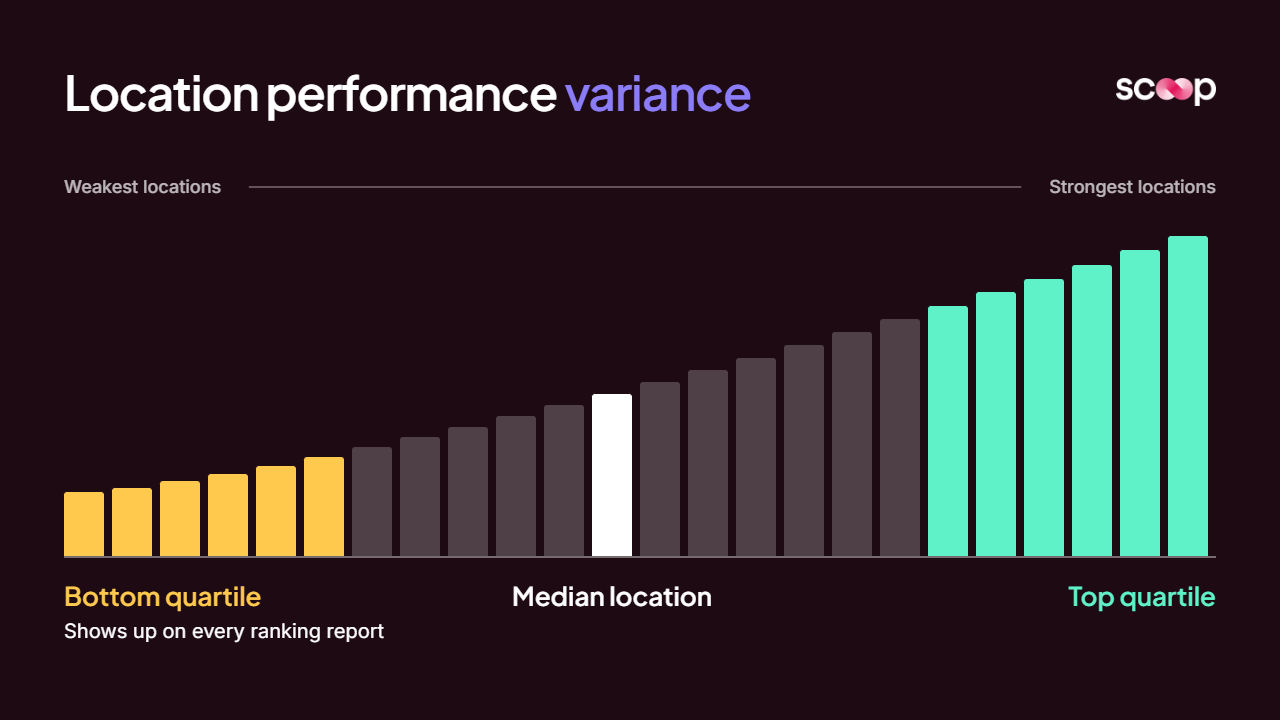
Most COOs already know variance exists. The bottom quartile shows up on every ranking report.
What they can't say is what it costs, why it happens, or which few locations to fix first. That gap is where the money goes.
What is location performance variance?
Location performance variance is the spread in results between locations that share the same brand, systems, prices and playbook. When two stores with the same concept, menu and point-of-sale system produce very different margins, the difference is variance.
It shows up in the metrics every operator already tracks:
- Restaurants: labor cost %, food cost %, average check, speed of service, daypart sales
- Hotels: RevPAR, GOP PAR, labor cost per occupied room, housekeeping productivity
- Franchise systems: unit sales against the system average, product cost variance, guest satisfaction
- Retail: comp sales, conversion, shrink, new versus repeat customers
Formal benchmarking compares a unit against a reference point. For a distributed business, the most useful reference points are internal: the median location, the top quartile, and each location's own healthier past periods. Most operational analytics programs already produce these comparisons. Few of them explain what the comparisons mean.
Variance isn't noise. It is the space between what your system can do and what it actually does.
How much does location performance variance actually cost?
The cost of location performance variance equals the revenue or margin you would recover if every underperforming location closed part of its gap to a chosen benchmark. You won't get an exact number. A directional one is enough to decide where to act.
The stakes depend on how thin your margins are. Restaurant365 data cited by SevenRooms puts net margins at 3 to 5% for full-service restaurants and 6 to 9% for quick-service. When margins are that thin, a two-point gap at one location can be half of that location's profit.
A simple formula for sizing the gap
Use this to get a first estimate:
- Pick the metric. Use one that drives margin, such as labor cost %, food cost % or GOP PAR.
- Pick the benchmark. The median gives a conservative estimate. The top quartile gives the ceiling.
- Calculate the gap. For each location below the benchmark, subtract its result from the benchmark.
- Multiply by volume. Multiply each gap by that location's annual revenue (or occupied rooms, or covers).
- Add it up and haircut it. Total the results, then assume you'll recover only a fraction of the total in year one.
The same arithmetic works on any line of the P&L. It's the same logic behind a variance calculator, applied to every location instead of to one budget line.
What the math looks like in a restaurant group
Here is an illustrative case (the inputs are assumptions, not customer data):
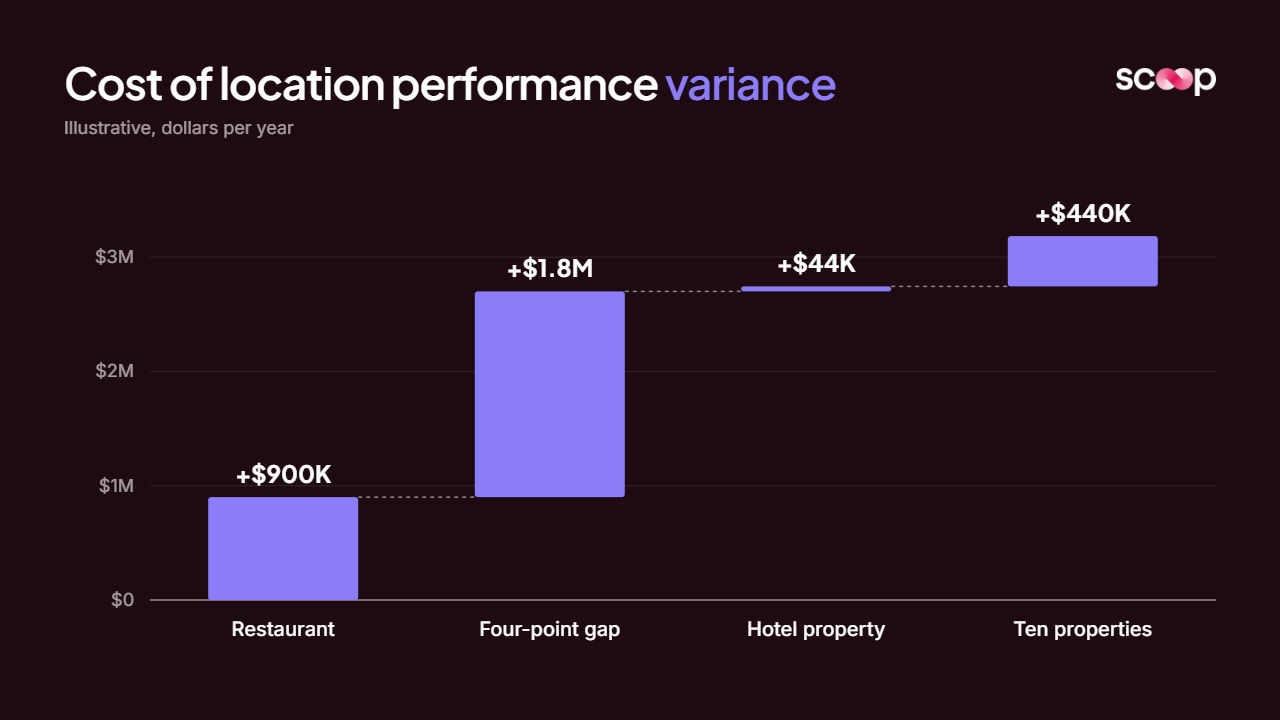
- 100 locations at an average unit volume of $1.8M
- The bottom quartile is 25 units
- Those 25 units run 2 points of margin below the median
That works out to 25 × $1.8M × 2% = $900,000 a year. At 4 points, it's $1.8M. And that's before you count the top-quartile ceiling or the drag on the middle 50%.
What it looks like in a hotel portfolio
One independent hotel operator uses a housekeeping benchmark of about 12.5 rooms per 8-hour shift in a midscale, limited-service hotel. That gives you a clean variance test.
Here is an illustrative property:
- 100 rooms at 70% occupancy, so 70 rooms to clean per day
- At 12.5 rooms per shift, that's 5.6 shifts. At 11 rooms per shift, it's 6.4 shifts.
- The difference adds up to roughly 2,200 extra labor hours a year
- At an assumed $20 loaded hourly rate, that's about $44,000 a year at one property
If 10 properties in a 40-property portfolio look like that, the gap is $440,000 a year in housekeeping alone. Energy, supplies and overtime come on top.
The same operator put the opportunity across a whole business this way:
"Pull another 10% out of your business with some very simple best practices." (Independent hotel management operator)
Why does variance persist even with mature BI?
Variance persists because only a few locations get a real look from someone who reads numbers well. The dashboards cover every location. The investigations don't.
The ceiling on investigation is structural:
- Few people interpret the numbers. Gartner research cited by IBM found that only 29% of employees, on average, use analytics and BI tools.
- BI teams are backlogged. Location-by-location investigation competes with board reporting, data requests and maintenance.
- Each location needs its own analysis. Investigating one store properly means running 20 to 40 separate queries, chosen for that store, from thousands of possible ones.
- Leaders travel. A COO choosing site visits from an airport lounge has time for a ranking, not a root-cause investigation.
Your existing BI stack is good at showing that a location moved. It isn't built to explain why at every location, every cycle. This is the known limitation of KPI dashboards: the chart raises the question and leaves someone to answer it.
Brad Peters, Scoop's founder, describes what most teams end up doing:
"You either take one analysis and copy it to everybody... If they want to do unique analysis per store but have it be trusted, that's what they can't do."
Copying one analysis across 200 locations is a dashboard with a summary on top. It isn't an investigation.
What causes performance variance across locations?
Performance variance across locations mostly comes from uneven judgment across the management chain. It isn't laziness. Leadership's ability to interpret the numbers doesn't reach every location, and nobody has handed the front line the tools to close that gap.
Scoop co-founder Neil Shepherd describes the pattern he sees in every large network:
"The COO and senior management have excellent operating judgments... when you get down to the district and location managers, that skill has dissipated away... people don't have time. This isn't their core job. So in the end, a lot of margin points just end up being left on the floor."
The causes are concrete and repeatable:
- Manager tenure. Black Box Intelligence reports restaurant management turnover of roughly 44 to 47% in limited service in 2024 and 2025. A large share of your managers are always new.
- Manager quality drives results. Gallup finds that managers account for at least 70% of the variance in employee engagement scores, and engagement shows up in service and labor numbers.
- Drift after rollout. Standards get set, then they slip. One hotel operator put it simply: "Five days later, some things can unravel." That's the drift problem at the unit level.
- Death by a thousand cuts. A strategy leader at a large retailer said it plainly: "When a store is doing poorly, there are literally 1000 reasons why that can be."
A new general manager overseeing 40 labor lines, 300 SKUs and a staffing crisis isn't failing at the job. They're doing a job that was never designed to include forensic data analysis.
What happened when one operator investigated every store?
When one multi-location retail operator had its stores investigated one by one, the results changed what management believed about its own recovery. Scoop did the work alongside the operator's BI team, which had enterprise tooling in place but couldn't prioritize a store-by-store investigation.
Brad Peters describes the engagement:
"I did forensics on the data that they've not been able to do themselves... It's the kind of stuff that has real tangible business results."
The question sounded simple: which stores recovered after COVID, which didn't, and why? Answering it took several layers:
- Each store against its own history. Many stores had come back but hadn't returned to pre-COVID levels.
- Each store against its peers. A favorable market tailwind had masked the gap in the overall numbers.
- Customer cohorts built from scratch. Repeat customers had dropped a little. New customers had dropped much more.
- The dividing line. The stores that recovered had brought in more new customers. The others were living off their existing base.
Answering it meant sweeping the database customer by customer, building new cohort and volume buckets, then running multi-variable analysis on top. That's well beyond the basic counts and sums a standard dashboard produces. It's also why retail store diagnostics stall inside most BI teams.
Scoop's engine computes the figures. The AI interprets them within the operator's rules. The arithmetic is never left to a language model's guess.
How do you review every location against the same standard?
You review every location against the same standard by codifying how your best operator reads the numbers, then running that logic across every location, every cycle. That's the core of AI performance management: your best operator's review, at every location instead of a lucky few.
Capture starts with people, not software. Brad puts it this way: "If I took a tape recorder and recorded everything you thought as you looked at your BI reports, we stick that into the system so it could do that on your behalf." The Scoop team sits with your COO and regional leaders during setup and records what they check first, which thresholds matter and which signals they act on.
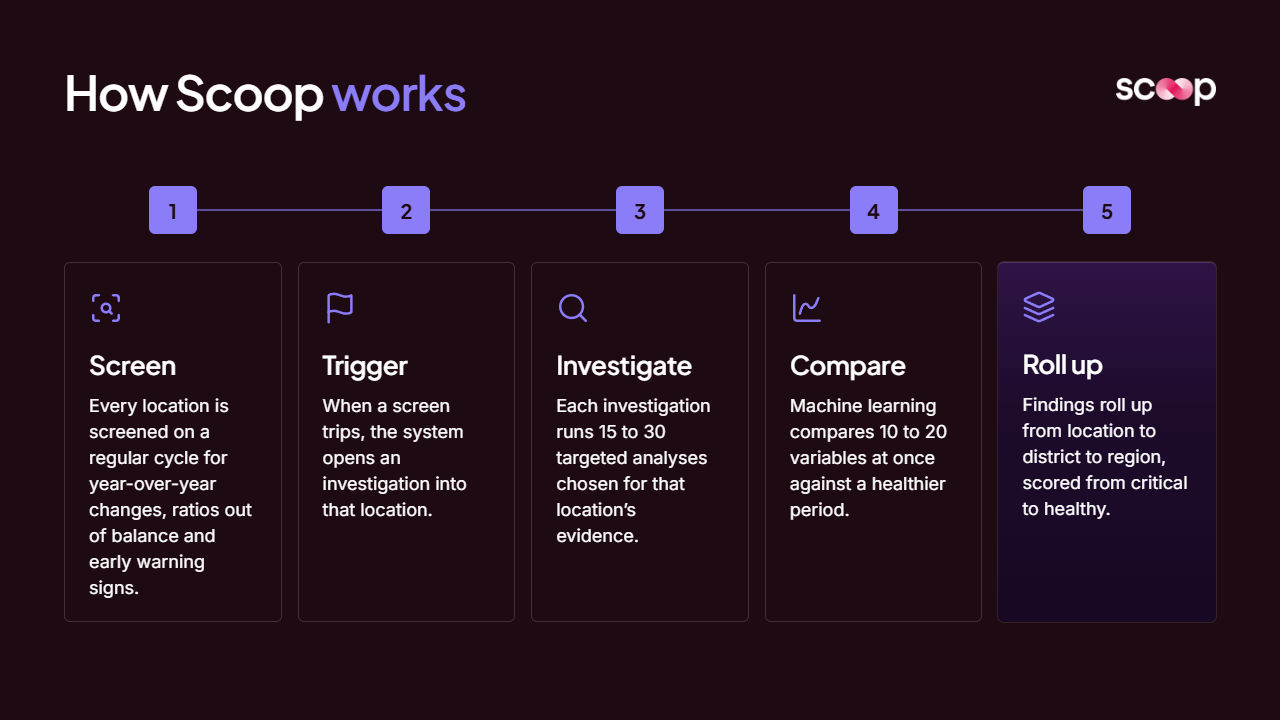
From there, how Scoop works follows a set sequence:
- Screening. Every location is screened on a regular cycle for year-over-year changes, ratios out of balance and early warning signs.
- Flag and spawn. When a screen trips, the system opens an investigation into that location.
- Probes. Each investigation runs 15 to 30 targeted analyses chosen for that location's evidence.
- Multi-variable analysis. Machine learning compares 10 to 20 variables at once against a healthier period.
- Synthesis and roll-up. Findings roll up from location to district to region, scored from critical to healthy.
The output is a report that arrives on schedule. Each manager gets a briefing with what changed, why, questions for the next visit and recommended actions. Nobody logs in or builds a query. That's the line between monitoring and investigation.
Scoop works as a managed service alongside your BI and your BI team. It replaces nothing.
What about independent hotels and smaller franchise operators?
For independent hotels and smaller franchise systems, management-company support is often out of financial reach. A typical hotel management agreement carries a base fee of about 3% of gross revenue plus an incentive fee of 8 to 10% of operating profit, according to Hospitality Net.
That leaves many owners without anyone reviewing their operations:
- One hospitality operator noted that management companies often send ownership a monthly report with "no advice, no guidance."
- Big chains rarely share their operational benchmarks with independents.
- Smaller franchisors rely on field consultants who visit each unit once or twice a year.
For these operators, the judgment of the best operators has to live in a playbook that runs everywhere. Scoop's work in hotels and hospitality and with franchise operators follows that model. As one operator described it: "Put a success system in a box."
Where should a COO start?
Start by sizing the gap on one metric, then give every location the same review for one full cycle. The first cycle shows you what the gap is made of.
A practical first 90 days:
- Size one line. Run the formula above on labor cost % or GOP PAR across all locations.
- Name the benchmark. Choose the median for a conservative number and the top quartile for the ceiling.
- Record your best operator. Write down how your strongest regional leader reads a location, in their own words.
- Review every location once. Not only the bottom 10. The middle 50% often hides the largest dollar total.
- Track the actions. Check next cycle whether each recommended action happened and whether the number moved.
Teams that want to measure business performance this way usually find the same thing. Data was never the constraint. Review capacity was.
Everyone is being asked for more from less. Not more dashboards. Not more licenses. A real review of every location, every cycle.
Built for the businesses that run everywhere at once.
Scoop exists to bring best-in-class operational diagnostics to every distributed business, not just the ones big enough to staff a team for it. Meet the people building it.
- Operator-first by design
- Built for distributed teams
- Diagnostics, not dashboards
Frequently asked questions about how much does location performance variance cost multi-location operators
What is an acceptable level of performance variance across locations?
No single figure applies to every business. Some variance comes from location factors you can't control, such as local demand, building age or labor markets. A practical test is whether the gap is explained: variance with a known cause and a plan is acceptable, and unexplained variance in the bottom quartile is a cost.
How do you identify which locations are underperforming?
Compare each location against three references: the median location, the top quartile, and its own healthier past periods. A location that trails its peers and its own history on a margin-driving metric is underperforming. Anomaly detection can flag the moment a location starts drifting, before it appears in a quarterly ranking.
What causes performance variance in restaurant or hotel groups?
The main causes are uneven manager experience, high management turnover, standards that slip after rollout, and local factors that nobody investigated. In restaurants, it shows up first in labor cost %, food cost % and speed of service. In hotels, it shows up in housekeeping productivity, labor per occupied room and energy costs at low occupancy.
How do franchise operators benchmark location performance?
Franchise operators compare unit sales, product cost and guest satisfaction against the system average and against top-quartile units. The weak point is interpretation: field consultants spend much of each call explaining how they reached a diagnosis. Automated, unit-level diagnostic analytics shortens that step so the call can focus on the fix.
How do multi-location operators review every location against the same standard?
They codify how their best operator reads the numbers, then apply that logic to every location on a fixed cycle. Each location gets its own investigation based on its own evidence, not a copied template. The result is a briefing per manager, rolled up by district and region, delivered without anyone logging in.
Get insights like this every week
Analytics, ops strategy, and product updates. No noise.
Keep reading
Why Multi-Location Businesses Lose Operational Knowledge Every Time Someone Leaves
What Is Tribal Knowledge in Multi-Location Operations?
Why Dashboards Don't Work: And What Has to Replace Them
Book a discovery call
Reach out to start a two-way conversation about your industry, your performance variations across locations, and whether Scoop is the right fit for you.