
What happens to operational visibility in the 90 days after an acquisition?
Financial data consolidates before close. Operating metrics take about 90 days. What goes dark on newly acquired locations, and how to close the gap.
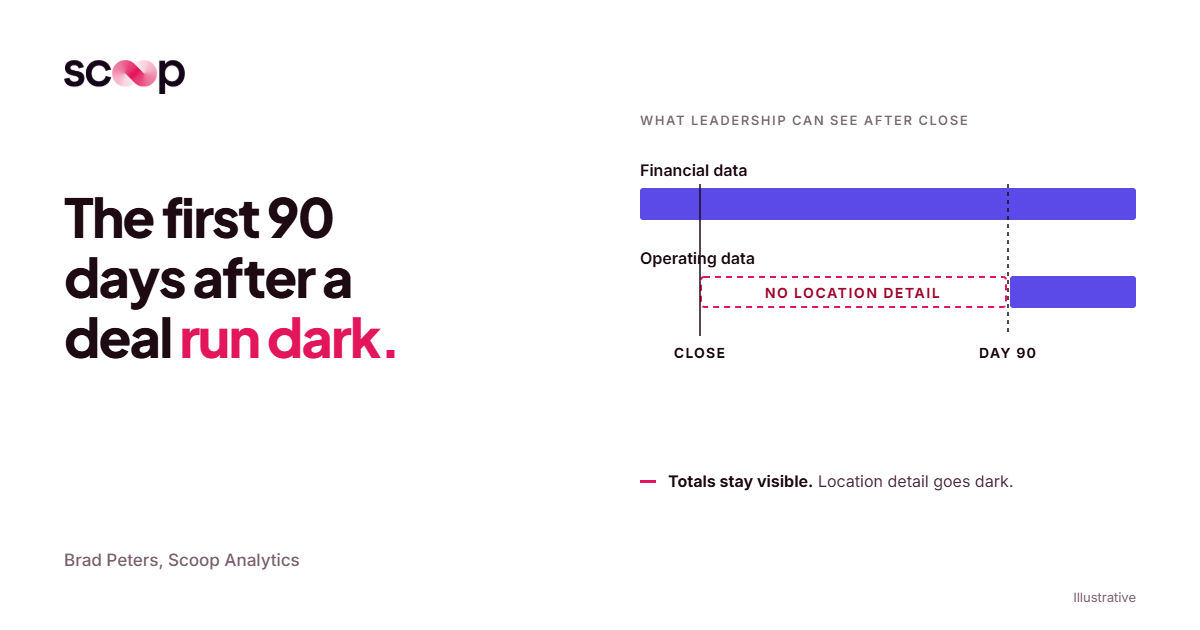
Operational Visibility in the 90 Days After an Acquisition
In the first 90 days after an acquisition, operational visibility on the new locations drops.
Financial integration starts before close, but operating metrics like labor, ticket size, and conversion take roughly 90 days to map. During that quarter, leadership sees consolidated totals while individual locations can decline unnoticed.
The financial close is done. The board wants a read on the new assets. And for most operators, the honest answer is that nobody knows yet.
That is not a planning failure. It is the normal shape of an acquisition, which means it can be anticipated.
The founder and CEO of a PE-backed medical aesthetics roll-up described the pattern plainly:
“Financial integration begins before close, while operating metrics take roughly 90 days to come online.”
For that quarter, the acquiring team runs the new locations without instruments, in the exact window when the fund wants real-time portfolio visibility.
This guide covers:
- Why financial data arrives first and operational data arrives late
- What goes dark first on newly acquired locations
- Why the data gap closes, but the judgment gap often never does
- How to start reviewing every new location before integration is finished
Why does financial data consolidate faster than operational data?
Financial data has a shared language. Operational data does not.
A trial balance maps to a chart of accounts, and diligence teams have usually scrubbed the seller's P&L weeks before close. Operating metrics live somewhere else: in each location's point-of-sale, scheduling, or practice management system, each with its own field names and definitions.
"Mapping is a mess, because every clinic names things differently."
— Founder and CEO, PE-backed medical aesthetics roll-up
His platform ran more than 20 different practice management systems at one point. Every acquisition added another set of definitions for a visit, a new patient, or a labor hour.
The survey data matches the field report. In Accordion's 2026 PE AI Adoption Benchmark, 71% of operating partners named fragmented systems with no clean data layer as a barrier, ranking it first of seven. Only 6% of portfolio companies arrive with clean, integrated data within the first 100 days.
Why financial data consolidates faster:
- A common standard exists. The chart of accounts is shared. Operating KPIs are not.
- Diligence already did the work. The P&L was rebuilt to price the deal.
- Operating data needs access first. Someone has to connect to every location system, extract, and map.
- Definitions vary by seller. Most acquisitions reveal that the seller's data is dirtier than the diligence deck suggested.
What goes dark first after an acquisition?
Location-level operating detail goes dark first. The totals stay visible.
The consolidated P&L still reports revenue and EBITDA for the new assets. What disappears is the layer underneath: which location is driving the number, and which one is quietly dragging it.
What typically goes dark in the first quarter:
- Labor scheduling against volume, by location and by day
- Average ticket and category or service mix
- Conversion, from consult to treatment or from foot traffic to sale
- Rebooking and repeat visit rates
- Staff and provider productivity against peers
The new locations also keep reporting on the seller's old rhythm, which is almost always less consistent than the legacy portfolio. So the operator ends up running two reporting cadences at once. A PwC survey of portfolio companies found 61% build a report or deck by hand to share data with their PE firm, and 54% send data as email attachments.
Standards slip fast when nobody is reading the detail. A hospitality operator described it in two words, even with rules hard-coded: "things unravel." That is the drift problem, and newly acquired locations are where it starts earliest.
It is also why dashboards don't work as a stopgap: a dashboard with half its feeds missing shows a confident total and nothing else.
What does a location-level blind spot actually look like?
It looks like a healthy total hiding a declining location.
When a platform adds several locations in one quarter, consolidated revenue rises almost by definition. That growth is real, and it also covers up any single site that is sliding.
The founder shared a real case from diligence. One clinic was carrying roughly 40% more labor than it should have, enough that any new revenue would see its margin "compressed drastically." The acquirer required the seller to reduce labor before the deal closed.
That problem got caught because the acquiring team had a benchmark and was looking. The same issue in a location nobody is reading after close becomes a quarter of margin leakage, and it shows up in the stores costing you margin only when the board asks why the add-on underdelivered.
Signals that a post-acquisition blind spot is hiding a problem:
- Labor hours rising while visits or transactions stay flat
- Ticket size holding while the mix shifts toward lower-margin services
- One top producer fully booked while the rest of the schedule has gaps
- A location that looks fine against its own history but weak against legacy peers
The cost compounds with deal volume. Bain's 2024 Global PE Report found close to 50% of add-ons are now at least a platform's fourth acquisition, up from 21% in 2003. Every deal resets the clock, and location performance variance widens each time.
Your dashboards show what happened. Scoop says what to do.
Scoop adds the diagnostic and action layer your BI tools cannot: finding what needs attention across every location, and what to do about it. Your stack stays exactly where it is.
- Sits on top of your BI
- Diagnostic and action layer
- No migration required
Is the blind spot a data problem or a judgment problem?
Both, and they are separate problems. Data lag is temporary. Interpretation lag often never gets fixed.
Data lag means the systems are not connected yet. Integration teams solve it, usually within the first quarter for the core operating metrics.
Interpretation lag is harder. Even when the data arrives, the acquiring operator does not yet know how to read those locations: what good looks like there, what normal seasonality is, or what a metric means in that format.
"A lot of organizations don't know how poorly they're doing this, or don't know what good looks like."
— Founder and CEO, PE-backed medical aesthetics roll-up
The people who could close the interpretation gap are scarce. KPMG's Value Creation in Private Equity report found operational staff average 10% of employees even at the 10 largest PE firms, and estimates firms need about three times as many.
So the read on a new location usually lives in one or two heads. That operational knowledge does not travel to the location's own managers, and it does not scale as the platform keeps buying. Capturing that tribal knowledge is the real integration task.
Codify what your best operators already know.
Scoop captures your operators' tribal knowledge, screens every location automatically, and delivers role-specific action plans. Nobody writes a prompt. The plan just arrives.
- Codified tribal knowledge
- Automatic screening
- Action plans, not dashboards
How can operators review new locations before integration is finished?
Apply one consistent standard to every new location, every cycle, using the data that exists now.
Waiting for clean data is the wrong default. Accordion, which advises portfolio CFOs, argues for scoping data to one use case and having people review the exceptions instead of holding out for a perfect data layer.
A practical sequence for the first 90 days:
- Start from diligence. The acquirer already pulled operating data to price the deal. Keep reading it after close instead of shelving it.
- Pick the short list. Labor as a share of revenue, average ticket, conversion, rebooking. The metrics that drove the investment thesis.
- Set a baseline per location. Compare each site to its own pre-close history and to comparable legacy locations.
- Write down how the best operator reads them. What they check first, which thresholds matter, which signals they ignore.
- Review every new location on the same cycle. Flag deviations, assign an owner, and check the action next cycle.
This is the layer Scoop adds. Scoop is an AI performance management platform that sits on top of existing BI and reporting tools. It does not replace the integration work.
Scoop's team sits with the operators to capture how they read a location, which Scoop's CEO describes this way: "If I took a tape recorder and recorded everything you thought as you looked at the BI, can we then stick that into the system so it could go do that on your behalf?"
Scoop then applies those operator-defined rules to every location each cycle, and a human team reviews the findings before the report goes out. For private equity rollups, that means new locations get the same read as the legacy portfolio, even while some feeds are still being mapped.
What should the board hear about new locations in the first quarter?
A story, not a status.
Most monthly operating reports run on green, yellow, and red. A color on a location nobody can read yet is a guess, and the founder was blunt about why the framing matters: "The cut of the numbers is everything."
"It's not just about whether they performed or didn't perform. Let's talk about why."
— Founder and CEO, PE-backed medical aesthetics roll-up
The pressure comes from above. An MSCI survey cited in the KPMG report found 52% of small GPs, and 68% of large ones, say they cannot meet LPs' demands for real-time reporting. That pressure lands on the operator in the first quarter after a deal.
A credible first-quarter update on acquired locations includes:
- Which new locations have operating data flowing, and which do not yet
- Each location against its pre-close baseline from diligence
- The two or three locations flagged, and why
- The action and owner for each flag
- What changes before the next cycle
That is the difference between reporting and value add in private equity. Monitoring shows what happened. Investigation tells you why.
The 90-day blind spot will open on the next deal too. The only choice is whether it opens on locations someone is already reading.
Built for the businesses that run everywhere at once.
Scoop exists to bring best-in-class operational diagnostics to every distributed business, not just the ones big enough to staff a team for it. Meet the people building it.
- Operator-first by design
- Built for distributed teams
- Diagnostics, not dashboards
Frequently asked questions
How long does post-acquisition integration take?
Financial integration usually starts before close. Operating metrics take about 90 days in the experience of one PE-backed roll-up CEO, and longer when systems are fragmented.
- Accordion's 2026 benchmark found 34% of portfolio companies need 12 or more months of data remediation.
- Only 6% arrive ready within 100 days.
- Waiting on clean data first delays the operating read far longer than needed.
How do PE firms monitor newly acquired locations?
Most rely on the monthly operating report, flash report, or KPI pack the portfolio company sends after month end. Those packs are often built by hand and stop at the company total.
- Location-level detail is usually the first thing missing.
- Funds that want a read on every unit need the review to happen below the monthly pack.
What operating metrics should be tracked first after an acquisition?
Track the metrics that drove the investment thesis, at the location level.
- Labor as a share of revenue
- Average ticket and service or category mix
- Conversion and rebooking rates
- Each site compared with peers, using a consistent way to benchmark locations
Can you diagnose a new location before its data is fully integrated?
Yes. Diligence data, the seller's own reports, and partial system feeds are enough to start a consistent review.
- Start with a simple five step check on any location that deviates from its baseline.
- Keep a person reviewing every flag, the core of human-in-the-loop AI.
- See how Scoop works for the location-by-location review cycle.
Get insights like this every week
Analytics, ops strategy, and product updates. No noise.
Keep reading
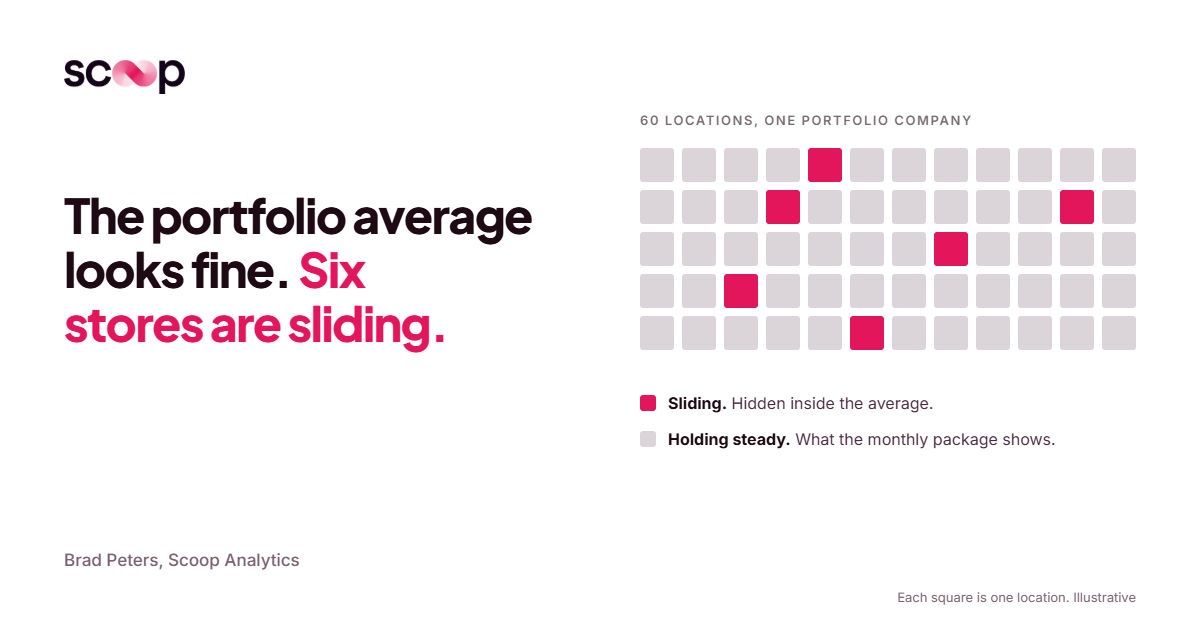
How do PE operating partners get real-time visibility into portfolio company performance?
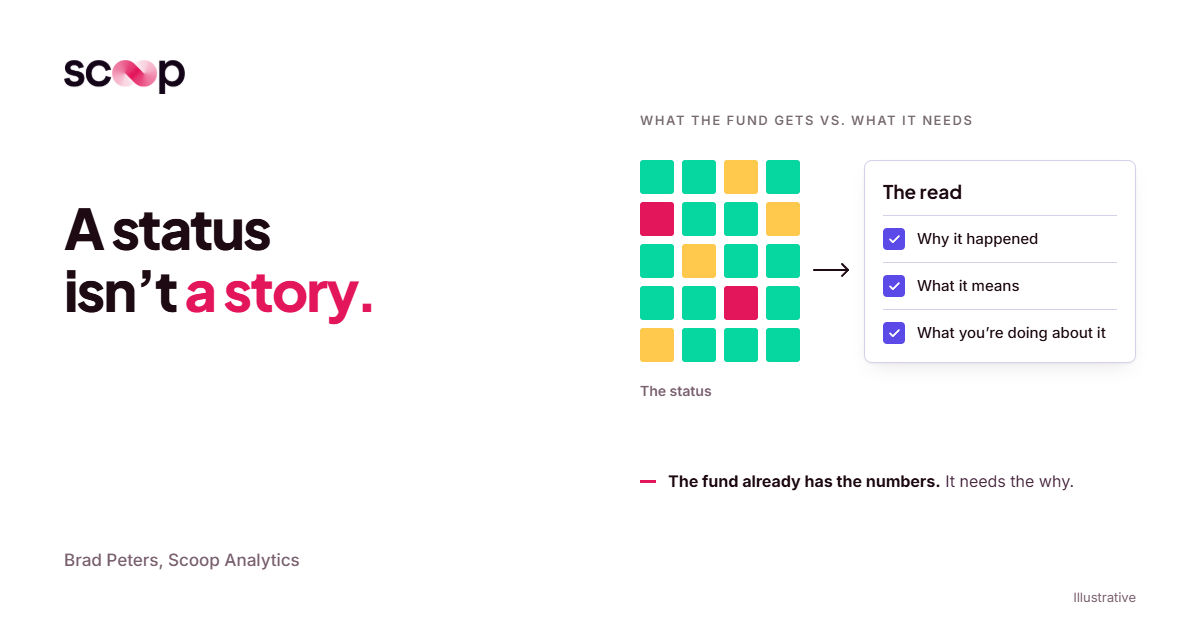
The Red/Yellow/Green Trap: Why PE Operating Reports Need a Story, Not a Status
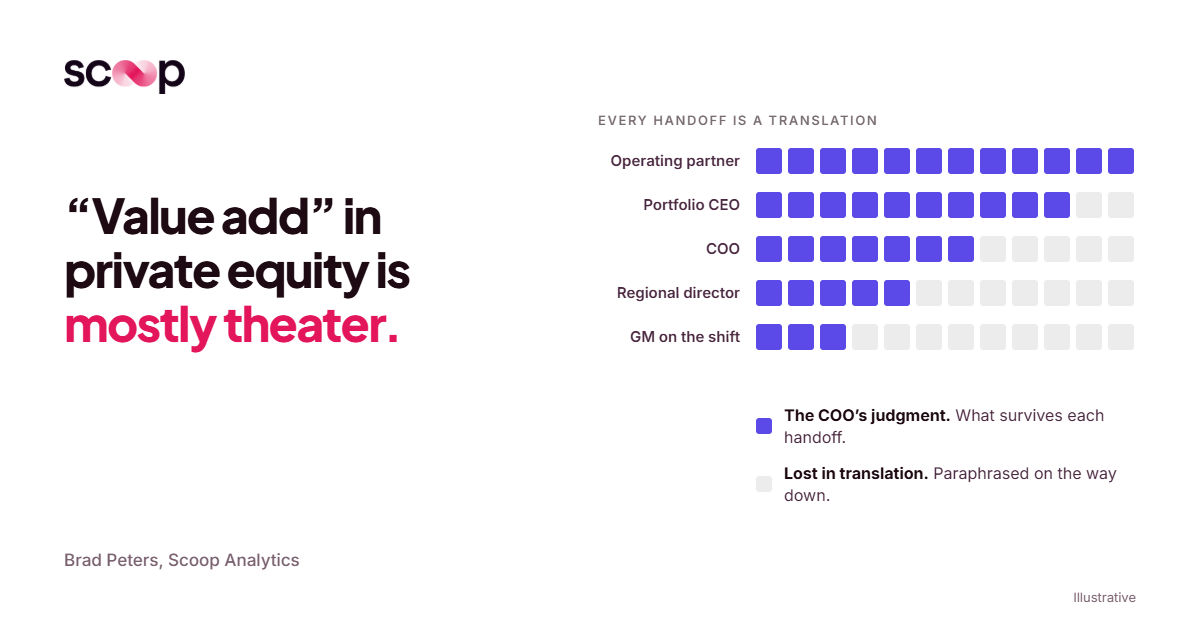
Why “value add” in private equity is mostly theater (and what would actually fix it)
Book a discovery call
Reach out to start a two-way conversation about your industry, your performance variations across locations, and whether Scoop is the right fit for you.