
The average is lying to you: how aggregate metrics hide location-level problems
A healthy district average does not mean every store is healthy. See how aggregate metrics hide location-level problems and what operators review instead.
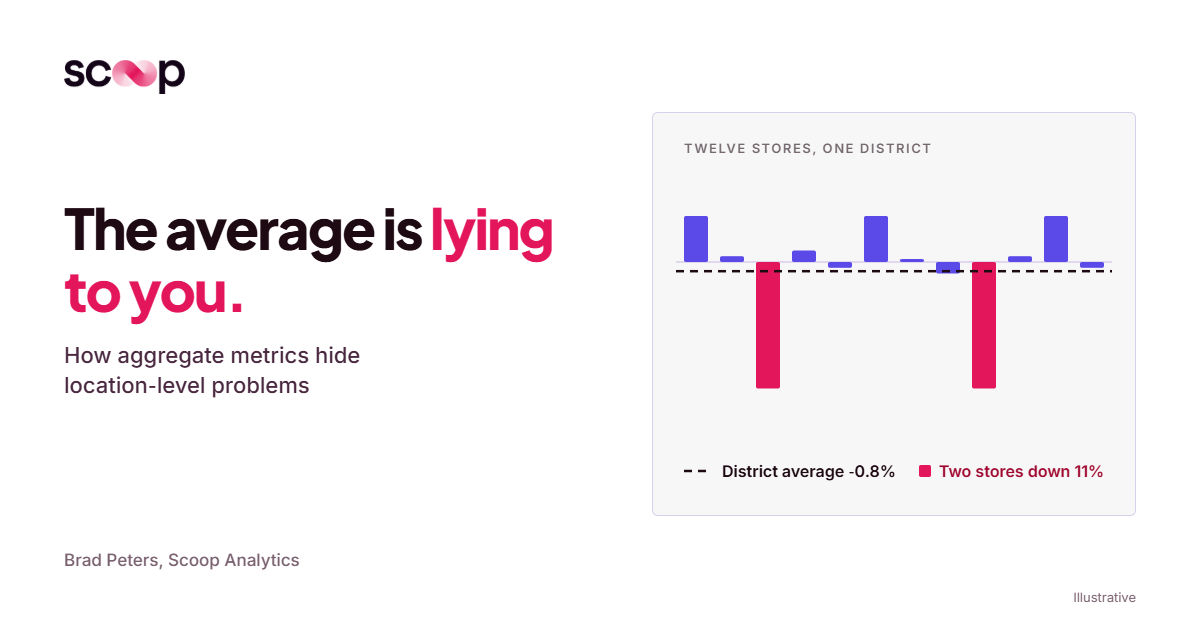
An acceptable district or portfolio average is not evidence that any single location is acceptable. Averages are built to cancel out variation, and in a multi-location business the variation is the signal. The only reliable way to find the stores being masked by the strong ones is to review every location, individually, every cycle, against the same standard.
The report said every store was lending too little. Most were lending too much.
Let me start with something that landed on my desk this week.
One of our customers, a large specialty retail chain with several hundred stores, runs a standard BI report on loan values for jewelry. It compares the average loan to a recommended high and a recommended low. Every cut of that report said the same thing: stores were loaning too little.
That reads like a clean, portfolio-wide finding. And it invites a portfolio-wide response. Tell the field to loan more.
The report was wrong. Not the data. The number.
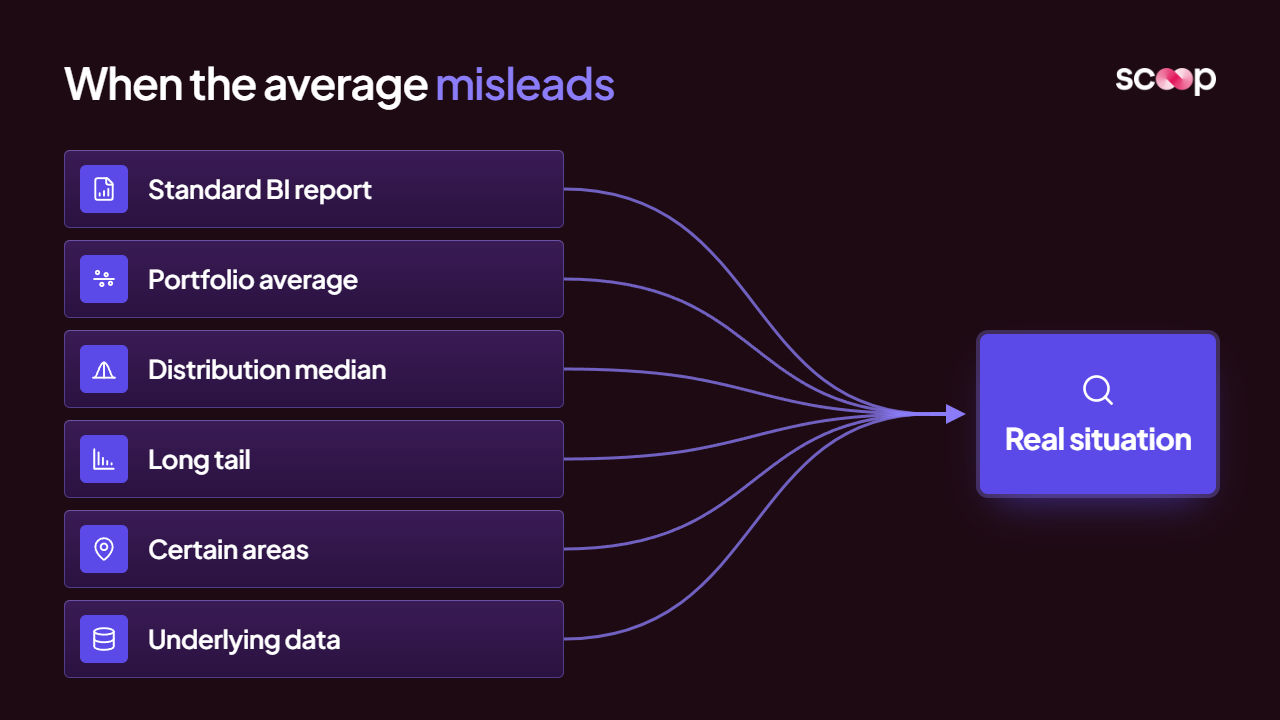
When we looked at the distribution instead of the average, the median sat above the high end of the recommended range. Most transactions were over the line. A long tail of small, low-end loans was dragging the average down and making the whole chain look conservative.
So the real situation was the mirror image of the reported one:
- What the average said: stores are under-lending, everywhere.
- What the distribution showed: most loans were over the high end, concentrated in certain areas.
- What was happening on the ground: jewelry was piling up in those areas, and it had only started building in the last two weeks.
- What the obvious fix would have done: told the over-lending stores to lend even more.
That last line is the one I keep coming back to.
The average did not just miss the problem. It invented a problem that did not exist at any individual store, and it pointed at a fix that would have made the real one worse.
We got a correction out quickly, because the underlying data is dense enough to cut by person and by week. A summary report never gives you that. But the lesson is not about speed. It is about what the summary was built to do.
Why is the average structurally blind to location-level problems?
The average is not broken. It is doing exactly what it was designed to do. That is the problem.
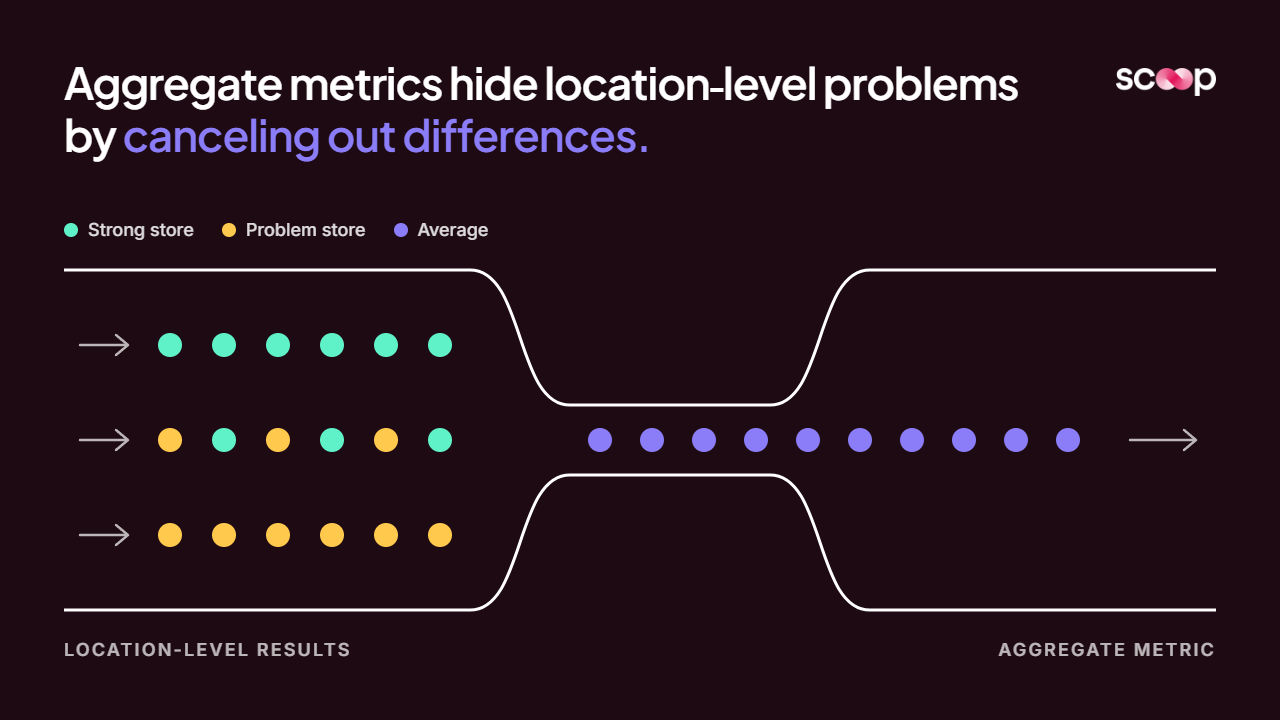
Most criticism of dashboards is that nobody uses them. I think the more dangerous case is the report that gets used every single week, exactly as intended. Aggregate metrics exist to compress many numbers into one by canceling out their differences. In a multi-location business, the differences are the whole job.
Here is what an aggregate does to a set of stores:
- It nets strong against weak: Two stores at +6% and one at -12% produce a district at 0%. Flat. Nothing to see.
- It erases shape: A lopsided distribution and a tidy one can share the same mean. The mean will not tell you which one you have.
- It lags the individual: One store down 10% moves a 30-store average by a third of a point. By the time the district number moves, that store has been in trouble for a quarter.
- It reports on a place that does not exist: Nobody manages the average store. There is no such building.
If you run operations at any scale, you have probably lived the moment this produces. The region looked fine. Then a store visit or a P&L review turned up a location that had been quietly sliding for two or three periods. The report was not hiding it through negligence. It was hiding it by construction.
I have written before about the real cost of location performance variance. The average is how that cost stays invisible.
Same number, different store: three patterns the average flattens
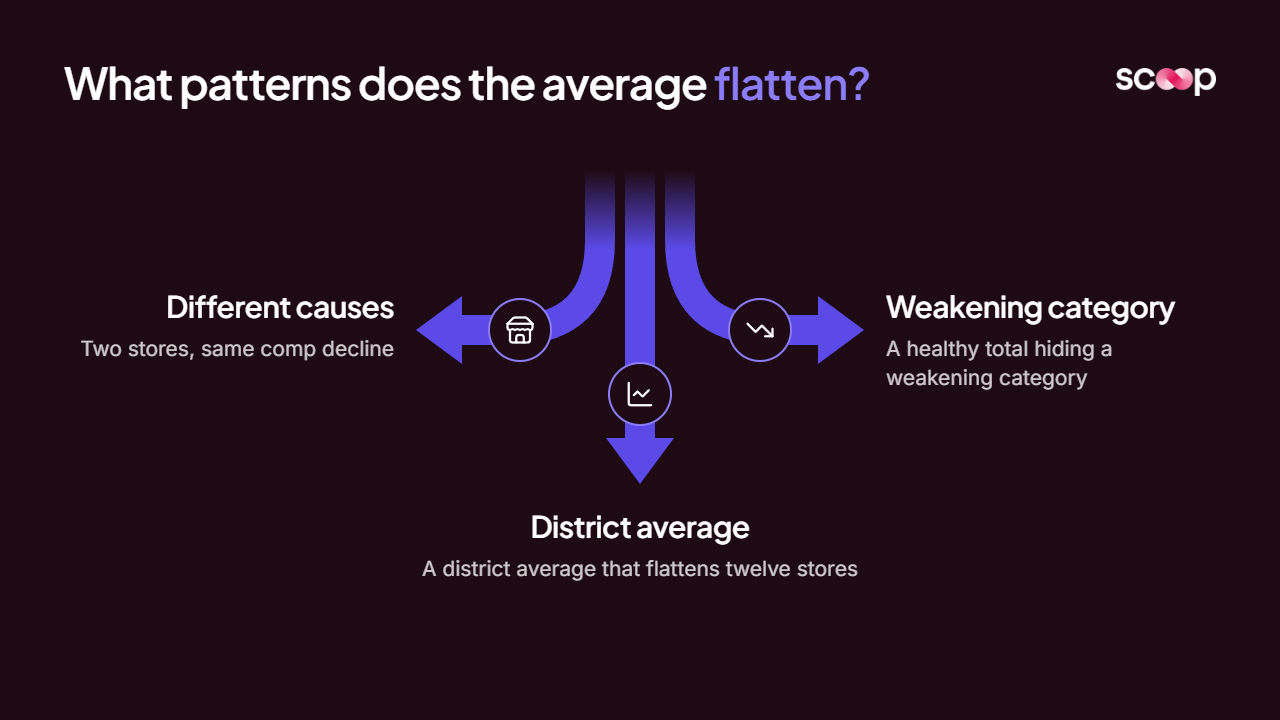
The jewelry case is dramatic. The everyday version is quieter, and it tends to show up in three shapes. The numbers below are illustrations, but every operator will recognize the pattern.
Two stores, same comp decline, different causes
Picture two stores, both down 8% comp.
- Store A: transactions down 11%, average ticket up about 3%. Fewer people are coming in. The ones who do are spending a bit more.
- Store B: transactions flat, average ticket down 8%. The same people are coming in and buying less.
On a district report, these are the same row. Same color, same arrow, same conversation.
They are not the same problem. For Store A, the figures establish a traffic decline, so what the manager should check is hours, staffing at peak, and anything new opening nearby. For Store B, the figures suggest a basket problem, so what the manager should check is attachment, out-of-stocks in add-on categories, and how the floor is being worked.
A strategy leader at a large retailer put it to me in a sentence I have not been able to shake:
"When a store is doing poorly, there are literally 1,000 reasons why that can be... it is usually death by 1,000 cuts."
An average hands you one number for a thousand-reason problem.
A healthy total hiding a weakening category
The store total is flat year over year. Green on the report. Inside it:
- A promotional category, about a quarter of sales, is up 20% on the back of a markdown event.
- The core category, about 40% of sales and the one that drives repeat visits, is down 12%.
- Inventory in that core category is climbing relative to its sales.
The total says nothing happened. The figures suggest the store is buying its comp with markdowns while the business that brings customers back is shrinking.
That is a next-quarter problem being reported as a this-quarter non-event. And inventory rising against falling sales is the shape that compounds: stock builds, discounting follows, margin thins, and someone overcorrects.
A district average that flattens twelve stores into one number
Twelve stores. District comp down 0.8%. Mild. A "watch" at worst.
- Two stores down 11% each.
- Three stores up 4% each.
- Seven stores roughly flat, each for its own reasons.
That district holds two stores in real trouble, three worth learning from, and seven with stories nobody has asked about yet. The district manager gets one number. The visit schedule usually gets built off that number too.
Rolling twelve different situations into a single row is one of the classic dashboard blind spots in multi-store retail. It is also the most expensive, because it decides where your best people spend their week.
What does an operator need instead of the average?
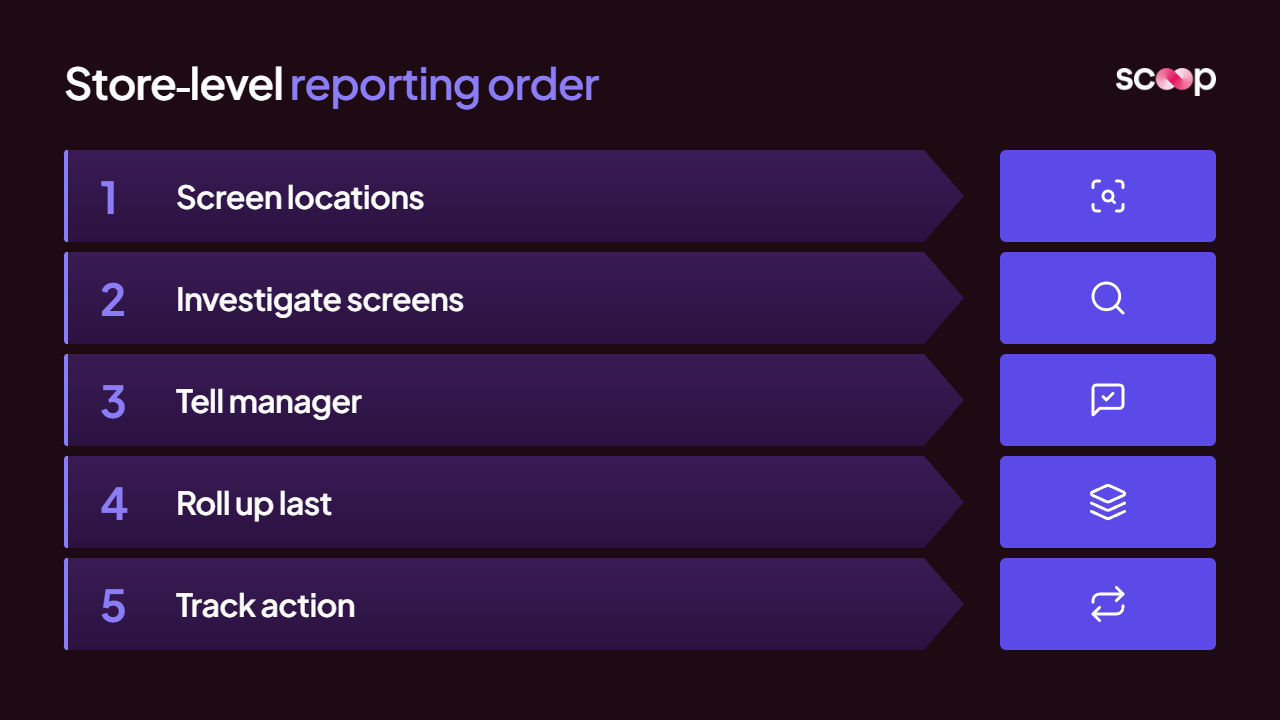
A read on every location, individually, every cycle, against the same standard. Before anyone looks at the roll-up.
The order of operations is the whole fix. Most reporting starts at the top and drills down when something looks off, which means the average is the trigger. A store only gets attention once it is bad enough to move the aggregate. By then you are managing the damage, not the cause.
Flip it:
- Screen every location every cycle: Not the ones that look off. All of them, against the same criteria.
- Investigate the ones that trip a screen: Comp, transactions, ticket, category mix, inventory relative to sales, conversion. Find what actually moved.
- Tell the manager what to check: The data surfaces the question. The manager confirms the answer on a visit or a call with the store. Data alone does not establish cause.
- Roll up last: District and portfolio views get built from the store-level reads, not the other way around.
- Track the action until it closes: Not a fresh plan every month. The same action, carried forward, until it is done.
That fifth step surprised me more than anything in the rollout we just went live with. Their old process was an Excel sheet with drop-downs. A new one every month, filled in to tick a box, then left on the side of the desk. When last month's action never got done, nobody did this month's either.
Now the district manager sends an action, the store manager acknowledges it, and it stays on the report with a deadline until it is complete. The district manager can see, store by store, who has acknowledged what. It is not rocket science. To the people in the field, it has been the world.
Why can't your best operator just do this every week?
Because there are too many stores and not enough of your best operator.
Reading every location the way your most experienced regional leader would, every week, is exactly the work that does not scale. So it gets replaced by the average, and the average gets trusted because it is the only thing anyone has time to read.
That gap is what we built Scoop for. It is AI performance management that sits on top of the BI you already run. It does not replace it.
- Capture: we sit with your best operator and record how they read the business. My shorthand for it: if I took a tape recorder and recorded everything you thought as you looked at your BI reports, we stick that into the system so it can do that on your behalf.
- Screen: every location, every cycle, against that logic.
- Investigate: when a screen trips, the system runs 15 to 30 probes on that store to find what moved.
- Deliver: a report arrives for each store and rolls up to district and region. Think of it as a Gartner analyst report for every store, with what the manager should check next.
That is what a read on every unit looks like in practice.
Read the stores first. Then read the average, if you still need it.
Built for the businesses that run everywhere at once.
Scoop exists to bring best-in-class operational diagnostics to every distributed business, not just the ones big enough to staff a team for it. Meet the people building it.
- Operator-first by design
- Built for distributed teams
- Diagnostics, not dashboards
Frequently Asked Questions
Why not just use the median instead of the average?
The median helps when the data is skewed. It is what exposed the jewelry problem. But it is still one number standing in for many stores. You need the distribution and a per-location read to know which stores are driving it.
Should district managers stop looking at averages?
No. Averages are useful for context and trend. They are a poor trigger for attention. Use them to describe the portfolio, not to decide which stores get a visit.
How often should every location be reviewed?
At the cadence the business runs on. For most multi-unit operators that means:
- Weekly, where data refreshes support it.
- Every two weeks at minimum, so a slide is caught within one or two periods instead of three.
Does location-level review mean replacing our BI tools?
No. The BI stack stays. The location-level read sits on top of it and tells each manager what the numbers mean for their store and what to check next.
Get insights like this every week
Analytics, ops strategy, and product updates. No noise.
Keep reading
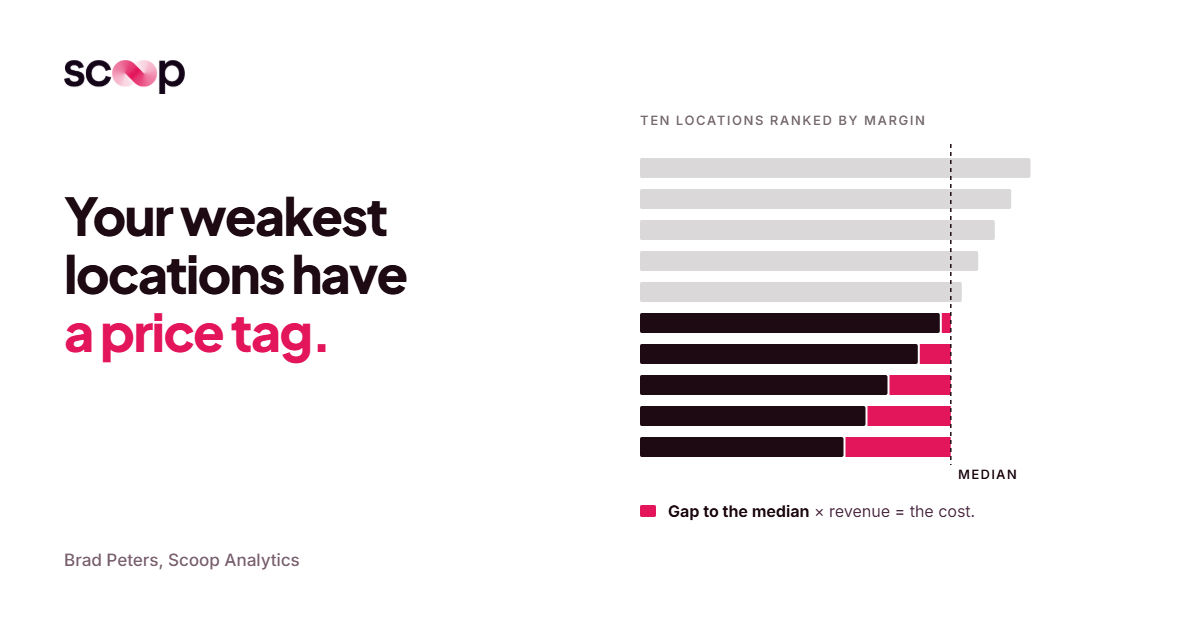
How Much Does Location Performance Variance Cost Multi-Location Operators?
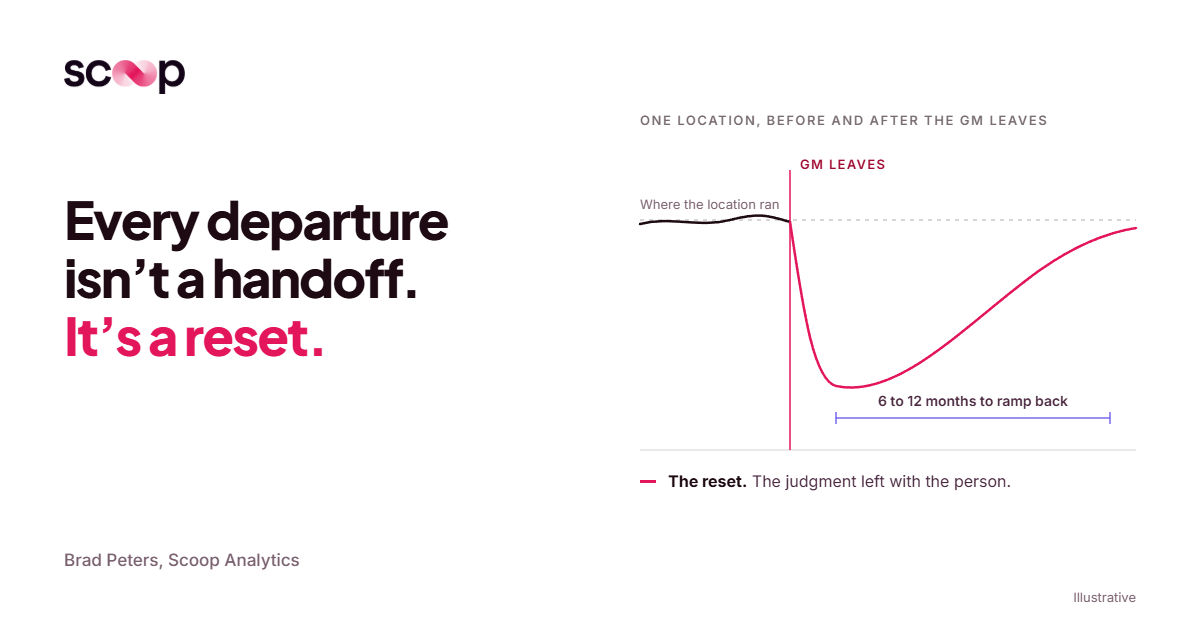
Why Multi-Location Businesses Lose Operational Knowledge Every Time Someone Leaves

The Best Retail AI Platforms for Multi-Location Operations
Book a discovery call
Reach out to start a two-way conversation about your industry, your performance variations across locations, and whether Scoop is the right fit for you.