
Scoop scales your tribal knowledge to the front line.
Scoop is an enterprise-grade AI platform that codifies your best operators' tribal knowledge on how they run their business, then uses it to investigate every location every reporting cycle, interpret dashboards, and generate action plans that boost revenue and margins.
Every location now has the expertise of the COO and regional managers, and there's no debate, just action.
Dashboards aren't actionable. We solve that.
Interpreting dashboards, and identifying and investigating issues, takes judgment and time that frontline managers often don't have. Senior leaders have that judgment, but can't scale it to every location either.
So the frontline loses time, waiting for a coaching visit, a manager who happens to ask the right question, or worse, issues pile up until they cost margin. Scoop solves that.
Here's how Scoop works.
Implement it, in 4 weeks or less.
Implementing Scoop is straightforward, and takes as little as four weeks to pilot, with no forward-deployed engineers required. We can help, or you can implement it yourself, in the environment of your choosing.
No forward-deployed engineers. We help, or you run it yourself.
Scan every location, every reporting cycle.
Scoop scans every location in your business, flags anomalies and adverse trends against benchmarks, targets, and history, and identifies what needs a closer look. Nothing gets missed, ever.
Every location, screened against plan, history, and peers.
Investigate performance issues.
For every issue it flags, Scoop runs a root cause analysis: why it's happening, and whether it's a one-off or an emerging trend worth acting on before it hits the bottom line.
New customer acquisition is falling 22–34% YoY while comp sales hold steady: sustained by repeat visits. This gap closes painfully within 3–6 months without intervention.
Generate corrective action plans.
Based on what it finds, and the tribal knowledge you've codified, Scoop generates corrective action plans, ranging from a helpful hint to a high-priority imperative, depending on your culture and the severity of the issue.
Visit stores 1268 and 1052 this week: review aged inventory and approve markdown plans.
Pull new customer acquisition detail for all four flagged stores by end of week.
Establish weekly new customer tracking with flagged store managers, with 30-day recovery targets.
Coordinate with marketing on localized acquisition outreach at stores 1129 and 1082 within 7–10 days.
Clearance rate up 18% WoW: floor space recovered ahead of schedule.
Traffic unchanged: originations still declining. Escalate to regional.
Deliver the briefing.
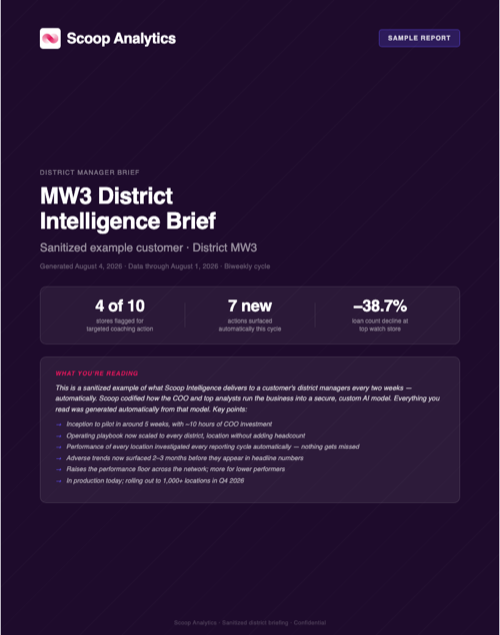
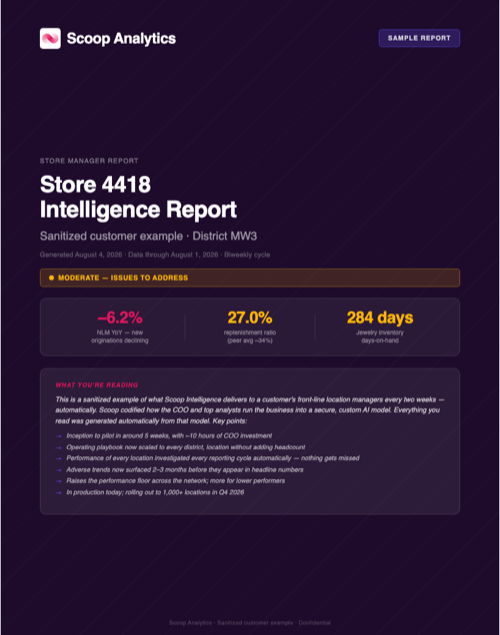
Every owner in the management chain gets an individualized briefing: what's happening in their business, why, and what they need to do about it. Frontline managers get their location briefing; district managers get an overview of their territory. Nothing gets missed.
Track actions, evolve the playbook.
Scoop tracks every suggested action. Managers can accept, defer, or reject with a reason, creating a closed loop that improves performance over time. Updating Scoop is as simple as walking it through a new or modified investigation in plain English.
Review aged inventory at Store 1052 and approve a markdown plan this week.
"If markdown discipline slips two cycles in a row, escalate straight to the district manager."
Collect the returns.
Customers cite improved performance visibility, faster decision making, and stronger frontline performance. As with other AI tools, newer or less experienced managers see the fastest improvement, but everyone benefits, and they like using it.
“The specific customers we are missing has been eye-opening.”
Built for security, connected to what you already use.
Scoop does not share your data or your operations with anyone outside the teams and systems required to deliver your implementation. We maintain strict separation between client engagements. Scoop became SOC 2 certified in 2025.
Layers on top of your existing BI stack: Power BI, Tableau, Looker, and 100+ more
Book a discovery call
Reach out to start a two-way conversation about your industry, your performance variations across locations, and whether Scoop is the right fit for you.