
How Do You Benchmark Locations Against Each Other Effectively?
Benchmark every location against peers, its history, last year, and target each cycle. Then investigate every flag before small gaps become losses.
Understanding multi location benchmarking
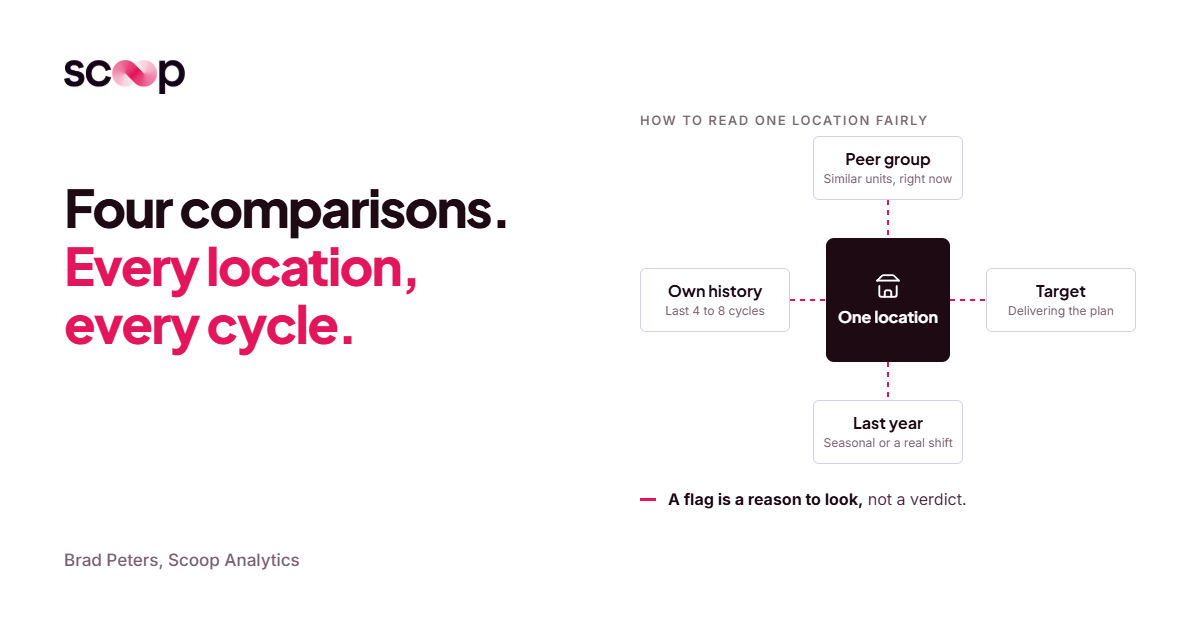
You benchmark locations effectively by applying one standard to every location every reporting cycle, comparing each site against its peer group, its own history, last year, and its targets. A flagged variance is a reason to look, not a verdict. Each flag needs an investigation and a plain brief to the manager before small gaps harden into structural losses.
Most operators already know who their best locations are. That was never the problem.
The problem is everyone else. It's the 40 units sitting between your best and your worst, drifting a little each cycle, where nobody notices until the quarter closes. Effective location benchmarking is about closing that gap on purpose. It is not about celebrating the top of the leaderboard.
This guide covers:
- Why the gap between best and worst matters more than the leaderboard
- The four comparisons every location needs, every cycle
- How to set review triggers that don't cry wolf
- Why a flag is only the start of an investigation
- Where AI performance management fits on top of the operational analytics you already run
Why isn't knowing your best location enough?
Knowing your best location isn't enough because the money sits in the spread, not at the top. Your best general manager is already doing the right things. The return comes from getting the bottom half of the portfolio to operate like the top half.
The spread is real and it is measurable. In the National Restaurant Association's 2024 operations data, full-service restaurants that turned a profit ran median labor costs at 34.2% of sales. Those that posted a loss ran at 42.9%.
That's 8.7 points of sales in one cost line. The menu economics are similar and the labor market is the same. The difference is execution.
Inside a single portfolio, the gap rarely looks that dramatic in any one report. It shows up as small, quiet habits:
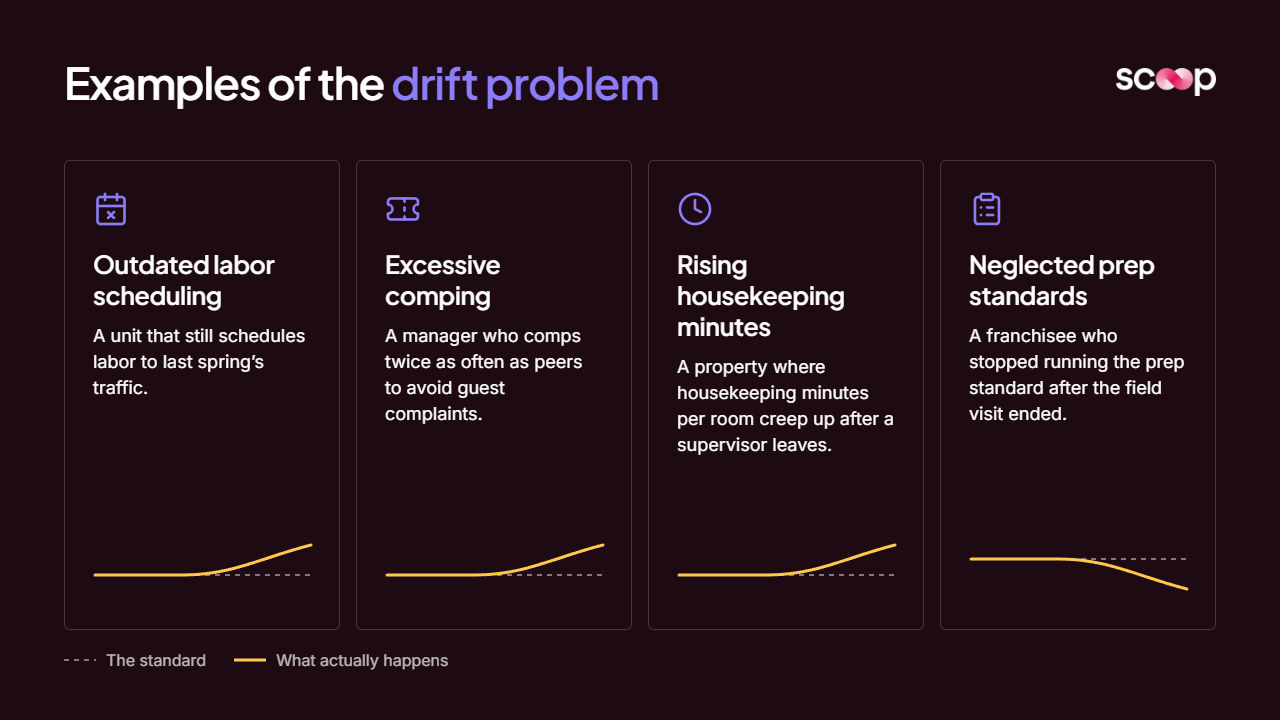
- A unit that still schedules labor to last spring's traffic
- A manager who comps twice as often as peers to avoid guest complaints
- A property where housekeeping minutes per room creep up after a supervisor leaves
- A franchisee who stopped running the prep standard after the field visit ended
Each one is easy to miss. Together they make up the drift problem: standards get set, then they unravel location by location.
Brad Peters, Scoop's founder, puts the goal this way: raise the floor of performance across the business, and spot the opportunities "that maybe your best performers would get intuitively, but most don't see." That is the real job when you measure operational performance across sites.
Why does inconsistency hurt more than a single bad location?
Inconsistency hurts more because a single bad location gets noticed and gets a visit. Inconsistency spreads across dozens of units, never trips one big alarm, and becomes the operating norm before anyone names it.
Run the arithmetic on a hypothetical 80-unit restaurant group averaging $2 million in sales per unit. If 27 of those units run labor two points above where comparable peers run, that's about $1.08 million a year. No single unit looks like a crisis.
Turnover makes this worse. In August 2026, the quits rate in accommodation and food services was 3.5% per month, against 1.9% for all nonfarm jobs. Black Box Intelligence reports restaurant management turnover at roughly 35% in full service and 44 to 47% in limited service.
Every time a manager turns over, the judgment at that location resets. Neil Shepherd, Scoop's co-founder, describes what operators see as a result: frontline managers who are new or stretched thin, and "big variation in performance."
Here's why spread does more damage than one obvious outlier:
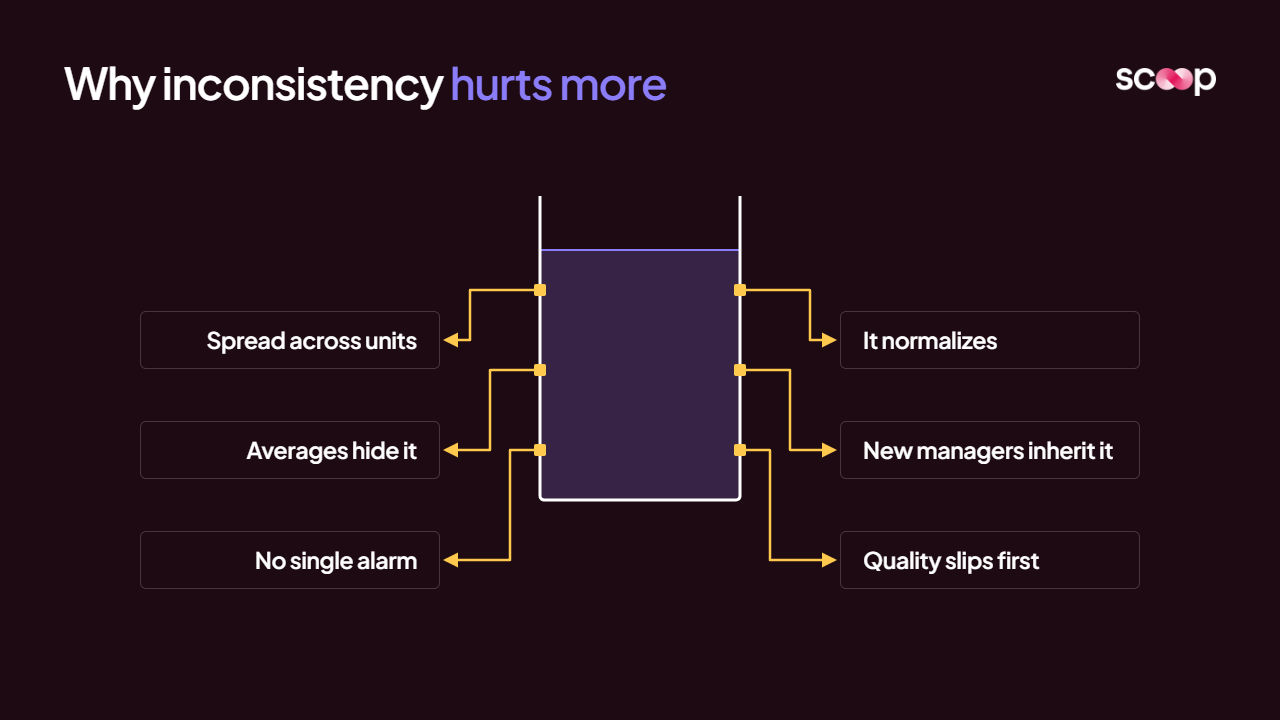
- Averages hide it: A portfolio average can hold steady while a third of units slide.
- No single alarm fires: Each unit sits just inside tolerance.
- It normalizes: Six months of 1.5 points over plan starts to look like the plan.
- New managers inherit it: The habit outlives the person who started it.
If you're trying to protect business performance across a distributed footprint, consistency is where the money is. It is also where quality of service slips first, long before a guest score shows it.
What does effective location benchmarking actually measure?
Effective location benchmarking measures each location against four reference points, every cycle, in the same way: its peer group, its own recent history, the same period last year, and its target. Each comparison catches something the others miss.
Benchmarking, in the formal sense, means comparing performance against a reference standard. In a multi-unit business, the standard has to be applied the same way everywhere. Otherwise you're comparing opinions, not locations.
Last year on its own can mislead you. In 2025, U.S. hotels posted occupancy down 1.2% and RevPAR down 0.3% for the full year, according to CoStar. A property down 1% versus last year may simply be tracking its market. A property down 1% while its peers are up 2% has a problem.
The same logic is why public chains report same-store sales rather than raw totals. It strips out new openings and closures so you compare like with like.
Pick key performance measures that managers can actually act on:
- Restaurants: labor cost %, food cost %, comp sales, guest count by daypart, average check, speed of service
- Hotels: RevPAR, ADR, occupancy, GOP PAR, labor cost per occupied room, guest satisfaction
- Franchise systems: unit sales versus system average, product cost variance, labor %, ticket average, speed of service
A balanced scorecard approach helps keep the set short. Six to eight metrics per location, read the same way every cycle, beats forty metrics read differently by every regional director. The same discipline applies to choosing hospitality analytics for a property portfolio.
Codify what your best operators already know.
Scoop captures your operators' tribal knowledge, screens every location automatically, and delivers role-specific action plans. Nobody writes a prompt. The plan just arrives.
- Codified tribal knowledge
- Automatic screening
- Action plans, not dashboards
How do you identify which locations are underperforming?
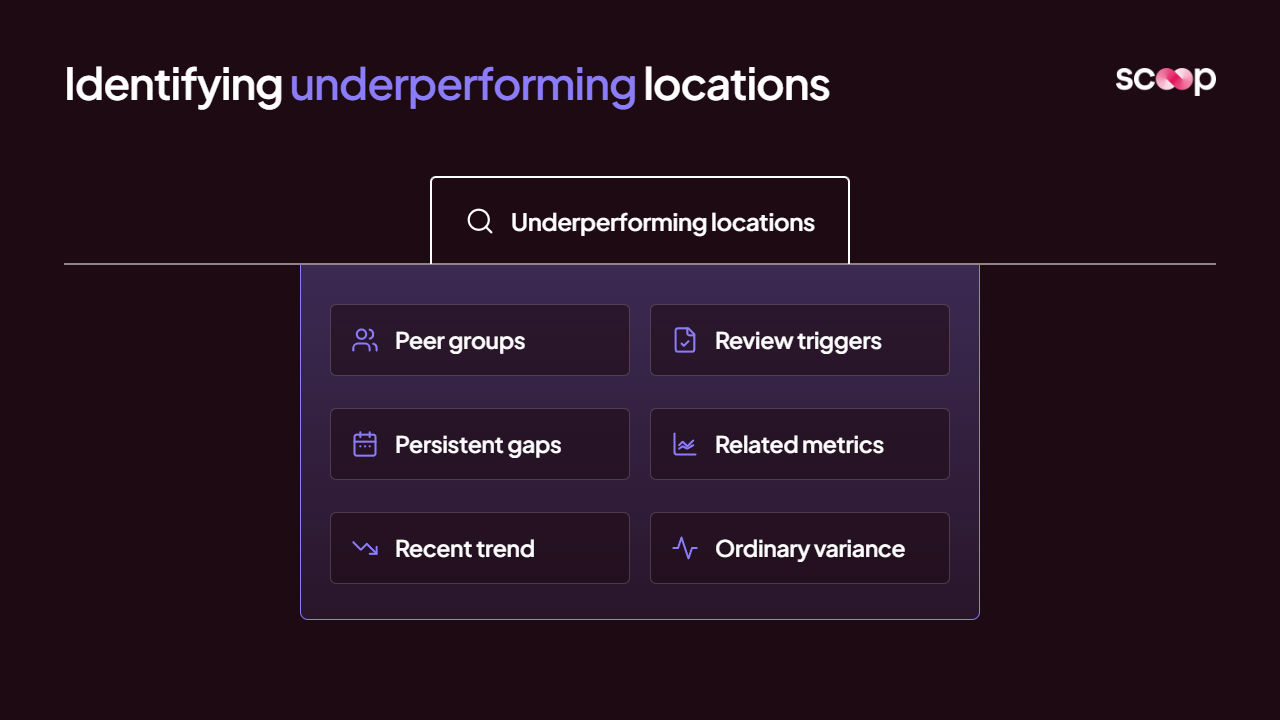
You identify underperforming locations by defining review triggers in advance, testing every location against a fair peer group, and requiring a pattern to persist before you escalate. Without those three rules, you either chase noise or miss real slides.
Start with peer groups. Comparing a 300-seat airport unit to a suburban drive-thru tells you nothing. Build peer groups on:
- Format: dine-in, drive-thru, select-service, full-service
- Size: seats, keys, or square footage
- Market type: urban, suburban, travel, resort
- Maturity: units still ramping in their first 12 to 18 months versus established sites
- Mix: daypart weight, group versus transient, delivery share
Then set triggers. A good review trigger is specific, written down, and applied to every location:
- A metric sits beyond a set distance from the peer median (for example, labor 2 points above)
- The gap holds for two or more consecutive cycles
- Two related metrics move together in the wrong direction (labor up while guest count is flat)
- A metric breaks sharply from the location's own recent trend
The persistence rule matters more than most operators think. Extreme results tend to drift back toward average on their own, a pattern statisticians call regression toward the mean. If you react to every bad week, you'll send managers chasing problems that would have fixed themselves.
Statistical anomaly detection helps separate a real break from ordinary variance. For hotel and hospitality operators with seasonal swings, it's what keeps a slow February from triggering 40 false alarms.
Why is a review trigger only a reason to look?
A review trigger is only a reason to look because a variance tells you where something is off, not why. The same number can come from four different causes, and each cause calls for a different response.
Take one unit running labor 3 points above its peer group. The cause might be:
- Overstaffing on slow dayparts
- A training week for a batch of new hires
- A drop in sales while staffing stayed fixed
- A payroll coding error that loaded another unit's hours
If you send a district manager in assuming the first cause, they'll have the wrong conversation in three cases out of four. This is the 10-hypothesis problem: every flag opens several plausible explanations, and checking them by hand takes days.
Even good research can only suggest a cause. Black Box Intelligence finds that full-service restaurants in the top quartile for hourly staff retention see 2.6% better comp traffic in the front of house. That's a strong signal. It still doesn't tell you whether a given unit's traffic problem is a staffing problem.
So every flagged location needs a diagnostic analytics pass before anyone acts. The output should be a short brief to the location manager with four parts:
- What the figures establish: The facts, with the comparison that makes them meaningful.
- What they suggest: The likely explanations, ranked, with the evidence for each.
- What to check: The specific things to verify on the floor or in the system.
- What actions are open: The options available to the manager, drawn from the operator's own playbook.
Here's an illustrative example for a restaurant unit:
- Established: labor at 33.8% of sales for two cycles, 2.9 points above the peer median. Guest count flat versus last year.
- Suggests: weekday lunch is scheduled at weekend levels. Labor hours rose 11% on Tuesday to Thursday with no change in covers.
- Check: the current schedule template, and whether the lunch-shift cap was removed when the new assistant manager started.
- Options: restore the template, shift one closer to the dinner peak, or hold staffing if a catering contract is starting.
The manager decides. The brief makes sure they're deciding with the evidence in front of them, not hunting through reports. That's the step that makes store diagnostics slow when people do it by hand.
Why does reviewing every location every cycle beat periodic manual audits?
Reviewing every location every cycle beats periodic audits because audits sample, and drift doesn't wait for the next visit. Coverage and cadence matter more than how deep any single visit goes.
Brad Peters describes what one multi-location COO told Scoop he wanted:
"His very, very best managers are great, but everything's inconsistent. So how do you raise the overall level of consistent performance, and how do you have people find stuff sooner and react to things better and faster?"Brad Peters, Scoop founder and CEO
Finding it sooner is the whole game. Brad has ridden along on district manager visits and seen the rhythm firsthand: managers go about once a week to their severe stores and less often to the rest. That's a sensible use of limited time. It also means the middle of the portfolio goes unwatched between visits.
Scale makes manual coverage harder every year. The International Franchise Association projects roughly 832,500 to 845,000 franchise establishments in the U.S. in 2026. No field team visits that many units often enough to catch slow drift.
Here's how the two approaches compare:
Dashboards don't close this gap on their own. The limitations of KPI dashboards show up exactly here: the data is there, but someone still has to read 80 views and decide what matters. That reading time is the biggest drain on operations leader efficiency in most distributed businesses.
Built for the businesses that run everywhere at once.
Scoop exists to bring best-in-class operational diagnostics to every distributed business, not just the ones big enough to staff a team for it. Meet the people building it.
- Operator-first by design
- Built for distributed teams
- Diagnostics, not dashboards
How does AI performance management apply your best operator's judgment to every location?
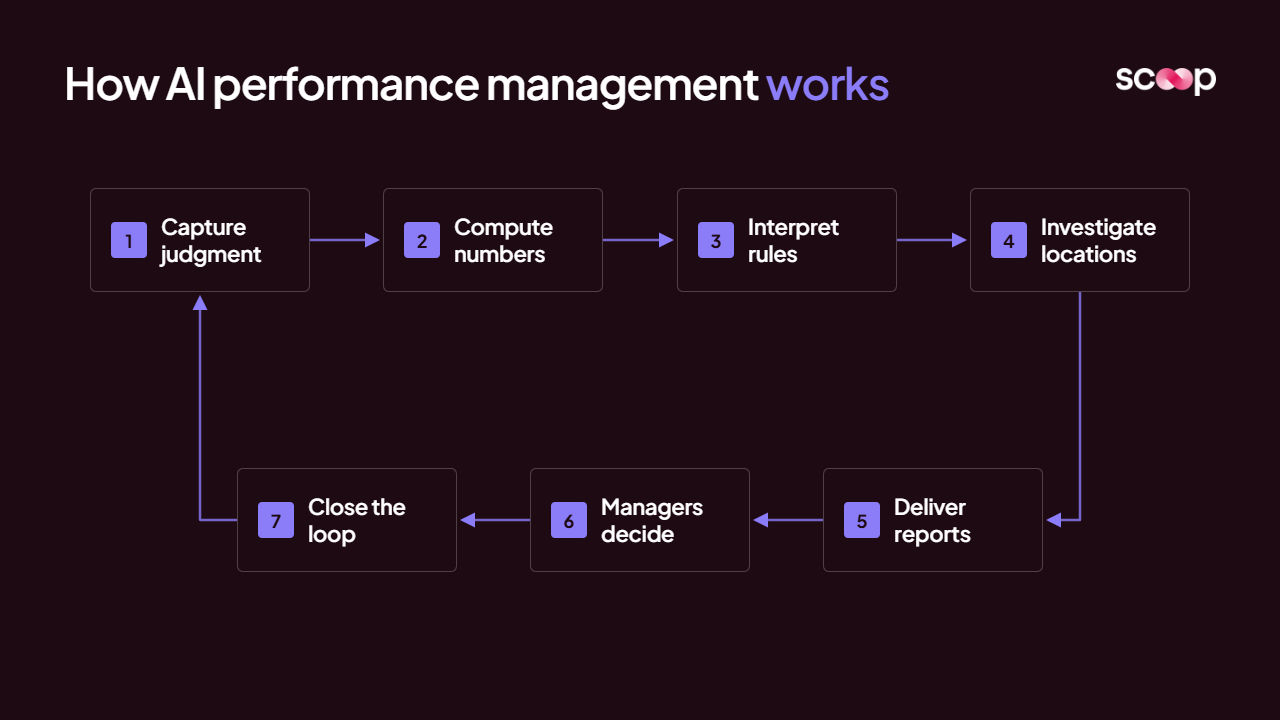
AI performance management captures how your COO reads the numbers, then runs that same review on every location every cycle and briefs each manager on what it found. The judgment stays your operator's. The coverage becomes total.
Neil Shepherd describes the output in the COO's own terms:
"The COO would do this. Here's what the COO found. Here's what you need to do to correct this adverse trend."Neil Shepherd, Scoop co-founder
Capture is the hard part, and it's hands-on. Scoop's team sits with your operators while they work through their reports, recording what they check first, which thresholds matter, and which signals they act on versus ignore. Brad explains it plainly:
"If we took a tape recorder and recorded everything you thought as you looked at your BI reports, we stick that into the system so it can do that on your behalf."
Here's how the review runs once that judgment is captured:
- The numbers come from your systems: Scoop's engine computes peer comparisons, trends, and variances from your existing BI stack and warehouse. Nothing is replaced or migrated.
- The AI interprets within your rules: It applies the review triggers and investigation paths your operators defined. It does not invent its own.
- Flagged locations get investigated: Each trigger launches an AI investigation that tests the likely causes before anything reaches a manager.
- A report arrives: Each manager gets a brief with what the figures establish, what they suggest, and what to check. Nobody logs in or builds a query.
- Managers decide: Scoop runs as a managed service. It informs the decision; it doesn't make it.
- Next cycle closes the loop: Last cycle's flagged items get checked again, so a fix that didn't hold surfaces quickly.
What it won't do matters just as much. It won't tell you a trigger proves a cause, and it won't promise a margin number before it has run on your data. It gives every location the same review your best operator would give, every cycle, and leaves the call with the person running the site.
Frequently asked questions
What metrics should you use for location benchmarking?
Use six to eight metrics that a location manager can directly influence, read the same way at every site. Strong performance measurement sets usually include:
- Labor cost % and product or food cost %
- Comp sales or RevPAR versus peer group
- Guest count or occupancy trend
- One service metric (speed of service, guest satisfaction)
Avoid metrics the manager can't affect, like regional marketing spend. A focused framework for performance measurement keeps the review actionable.
How often should you compare location performance?
Compare location performance every reporting cycle, weekly or biweekly for most restaurant and hotel operators. The cadence should match how fast a manager can act:
- Weekly: labor, sales, guest count
- Biweekly or monthly: cost of goods, guest satisfaction trends
- Quarterly: strategic peer-group resets and target reviews
The research on how tracking improves performance points the same way: regular, consistent review beats occasional deep dives.
How do you benchmark franchise locations fairly?
Benchmark franchise locations fairly by comparing each unit to a peer group with the same format, market type, and maturity, not to the system average alone. Fair comparison for franchise operators means:
- Separating ramping units from established ones
- Adjusting for trade area and daypart mix
- Sharing the comparison logic with franchisees so the standard is transparent
What is the difference between benchmarking and ranking locations?
Ranking tells you who is first and who is last. Benchmarking tells you how far each location sits from a fair standard and why. The difference maps closely to descriptive vs diagnostic analytics:
- Ranking: a sorted list, useful for recognition
- Benchmarking: a gap, a cause, and a next step, useful for improvement
Do you need to replace your BI tools to benchmark locations this way?
No. Location benchmarking at this level runs on top of the BI and warehouse data you already have. Most multi-location operators, from hotel groups to chains investing in retail analytics, already have the numbers. What's missing is:
- One standard applied to every location
- An investigation for every flag
- A brief that reaches the manager before the problem compounds
Get insights like this every week
Analytics, ops strategy, and product updates. No noise.



Book a discovery call
Reach out to start a two-way conversation about your industry, your performance variations across locations, and whether Scoop is the right fit for you.