
In the future, every manager will have an AI decision agent
BI put the numbers in front of everyone. It never made a single decision. The next generation of enterprise software will, and the companies that adopt it first will run every location like their best one.
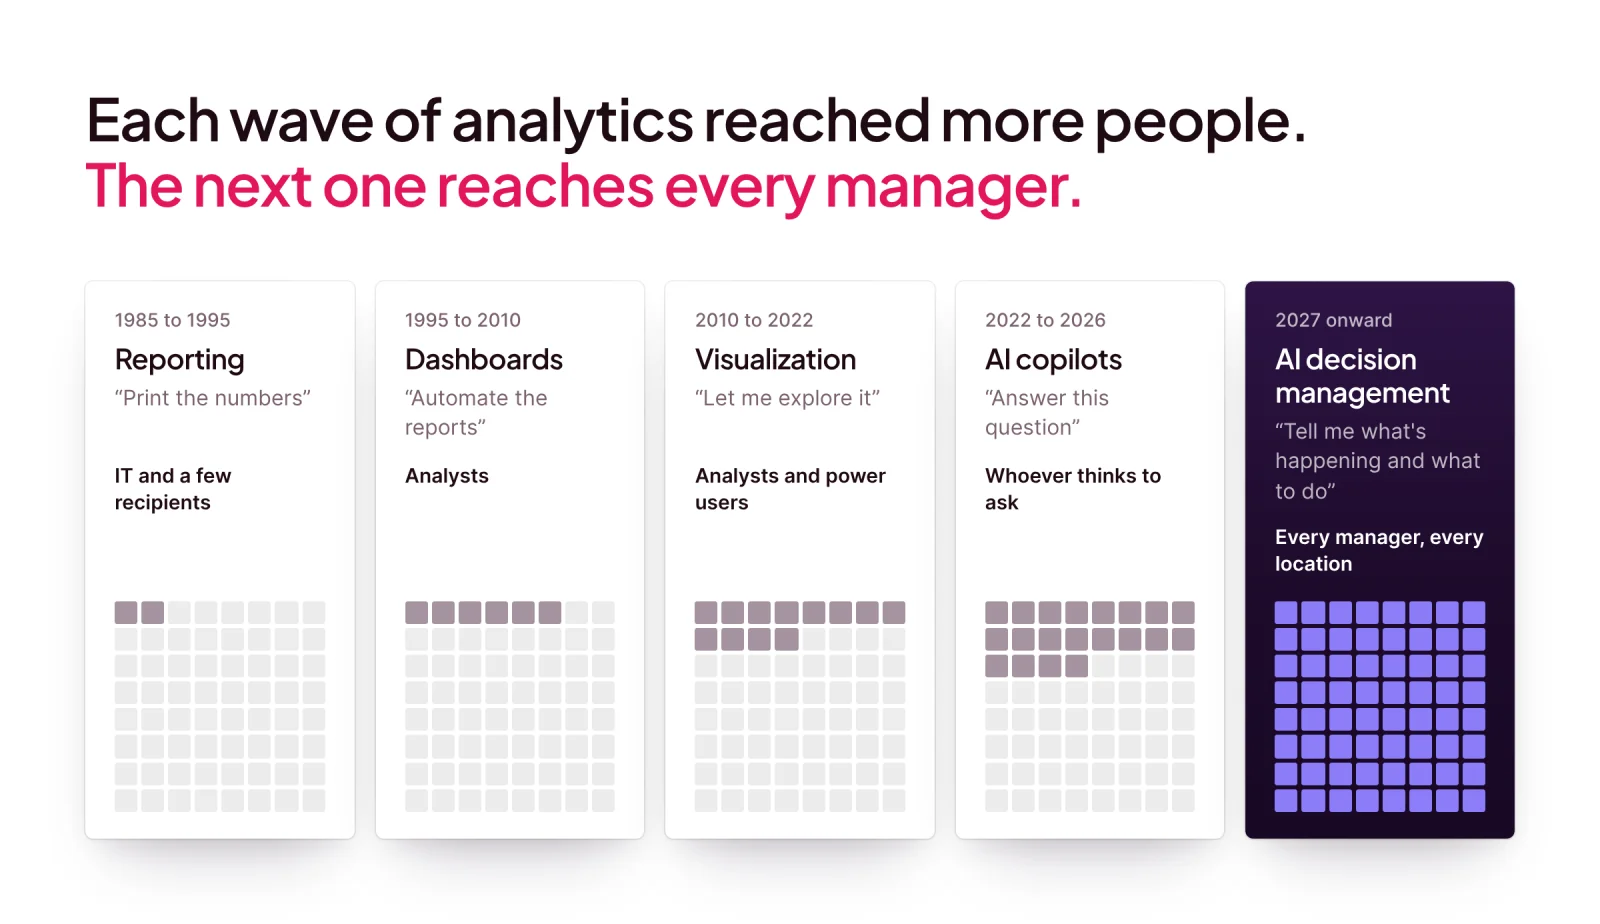
BI put the numbers in front of everyone. It never made a single decision. The next generation of enterprise software will, and the companies that adopt it first will run every location like their best one.
Part 1 of 8 · The AI decision management series
Written for: COOs, heads of operations and private equity operating partners who run many locations, teams or accounts. Reading time: about 8 minutes.
What you'll learn
- Why analytics has stalled at the chart for thirty years, and what replaces it
- What an AI decision agent does for each manager, every week, and the ten jobs behind it
- How the closed loop makes it better every week, and spreads what works to every location
Why read it: if your managers spend their week finding problems instead of fixing them, this is the map of what changes, and what it takes.
01 · BI scaled the numbers. Nobody scaled the judgment.
Your BI stack tells you what happened. Running a business has always turned on the next two questions: why did it happen, and what do we do about it? For thirty years, analytics answered the first question for more and more people and left the other two to whoever had time.
That is about to change. Foundation Capital calls the missing layer a context graph: the record of why decisions get made, not just what happened. Palantir has shown that modeling decisions, not just data, works at the highest stakes (Palantir). The ideas are settled. But most companies still try to get from dashboards to decisions with a chat box on top of their BI. That gets you a demo, not a decision.
Our bet: within five years, every manager, from the store floor to the boardroom, will have an AI decision agent that reads their numbers, works out why they moved, and tells them what to do this week.
02 · What changes: the agent does the analysis, the manager makes the call
Today, BI gives hundreds of managers the same dashboard and leaves the analysis to each of them. Some check three filters. Some decide it looks fine. Most don't have time to look. Nothing they decide is recorded, so nothing is learned.
An AI decision agent turns that around. It takes your best operators' know-how and your playbooks, runs them against the same data for every store, product, rep or customer, every week, and hands each manager the answer instead of the dashboard.
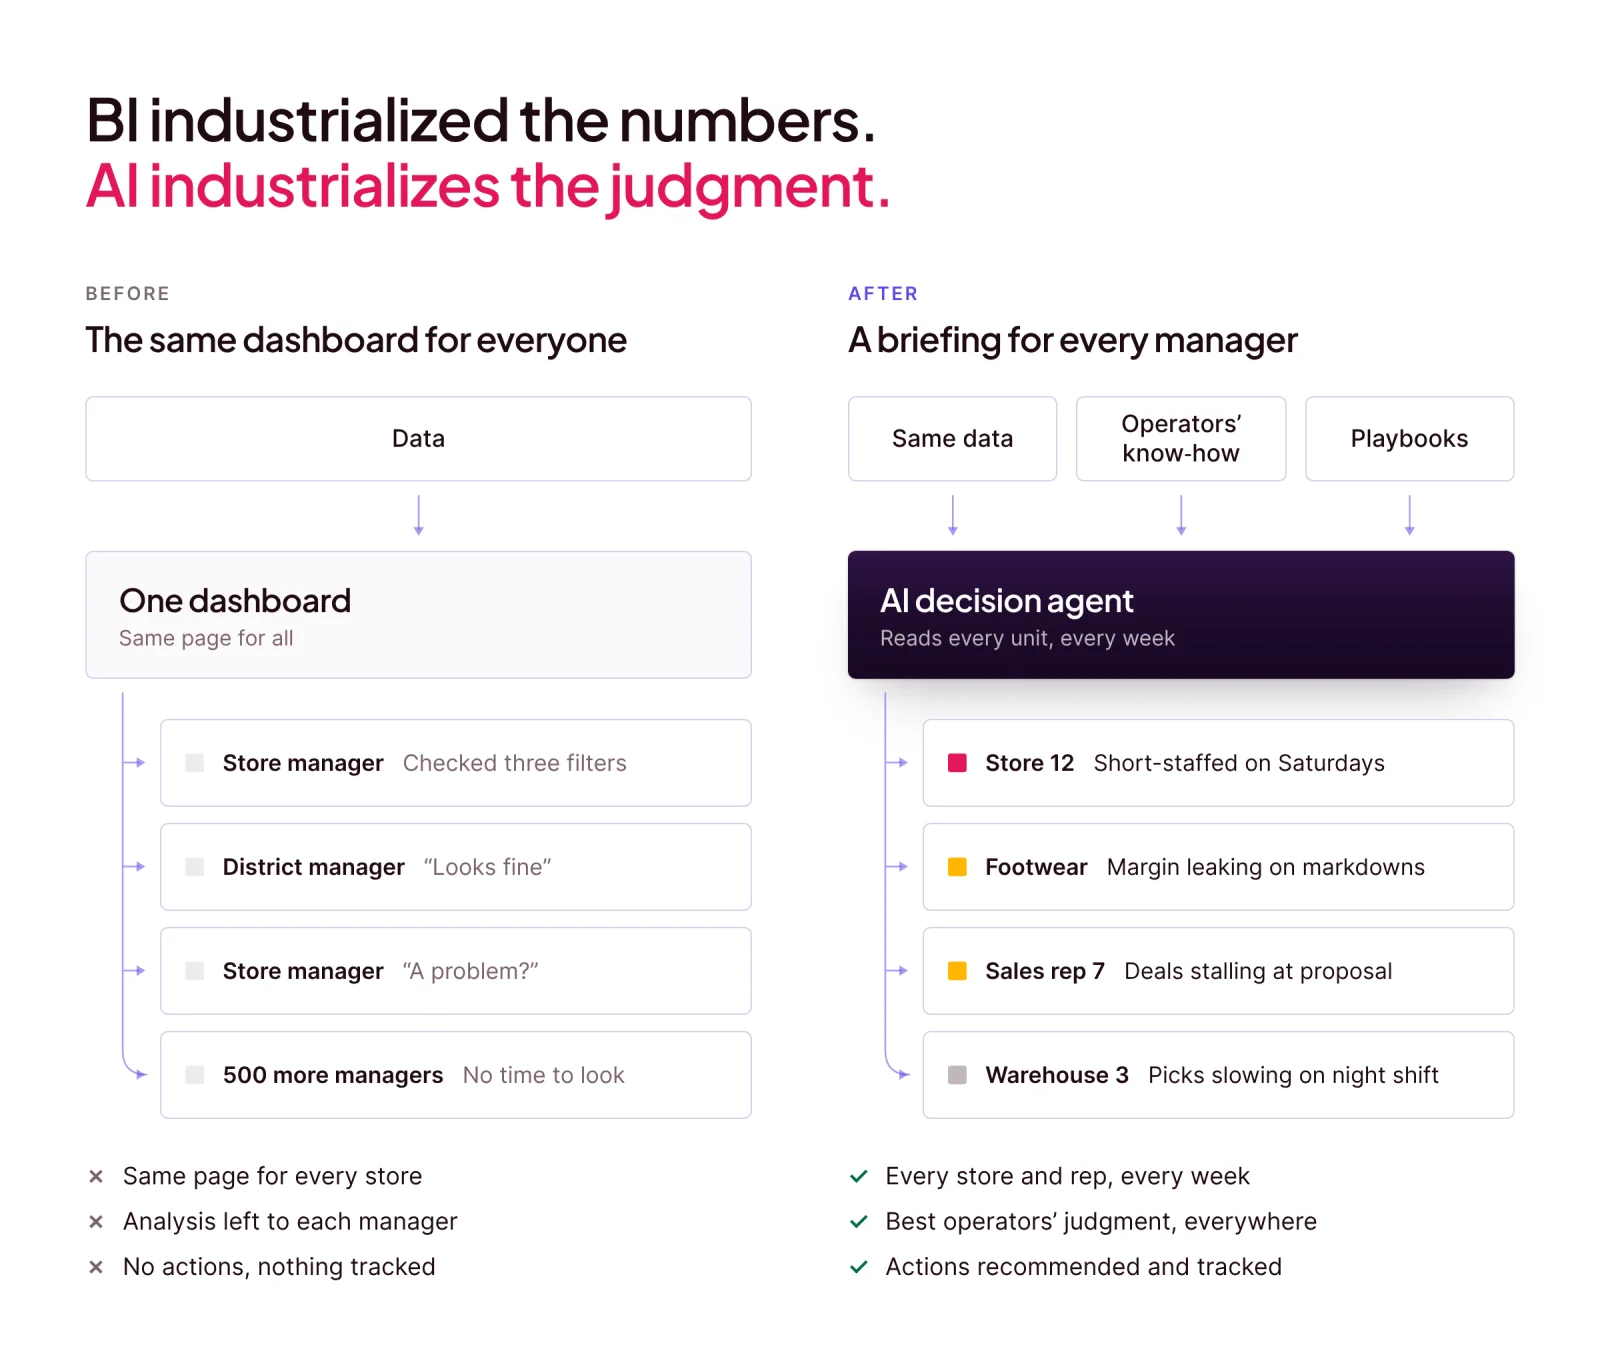
What the agent does for each manager
- Reads everything, every week. 40-plus investigations for every location, not just the ones someone remembers to check.
- Explains why. Not "Saturday sales are down 22%," but why: staffing was cut at the busiest hours.
- Says what to do. Two or three actions from your own playbook, each with an owner, a baseline and a goal.
- Briefs every level. Store, district, region and executive each get a briefing built from the same numbers. For regional leaders it can draft the weekly report in their own voice.
- Tracks what happened. Managers accept, defer or reject each action, and next week the agent reports whether it worked.
- Learns. Every choice and result refines the playbook, so the next recommendation is better.
What a Monday briefing looks like (illustrative retail example)
Severe · visit this week. Saturday sales are 22% below last year. Traffic held, but conversion fell from 31% to 24% after a schedule change cut staffing from noon to 4pm.
Do this: 1. Restore Saturday staffing, noon to 4pm. 2. Recheck next Monday.
Four weeks later: Saturday conversion back to 30.4%. Severe to healthy.
The manager doesn't open a dashboard, write a query or learn a new tool. The briefing arrives by email or in the tools they already use.
03 · Ten jobs behind every briefing
Behind every briefing are ten jobs the agent does without being asked. A dashboard does part of the first one. A chat-with-your-data tool does parts of the fourth and fifth, when someone asks.
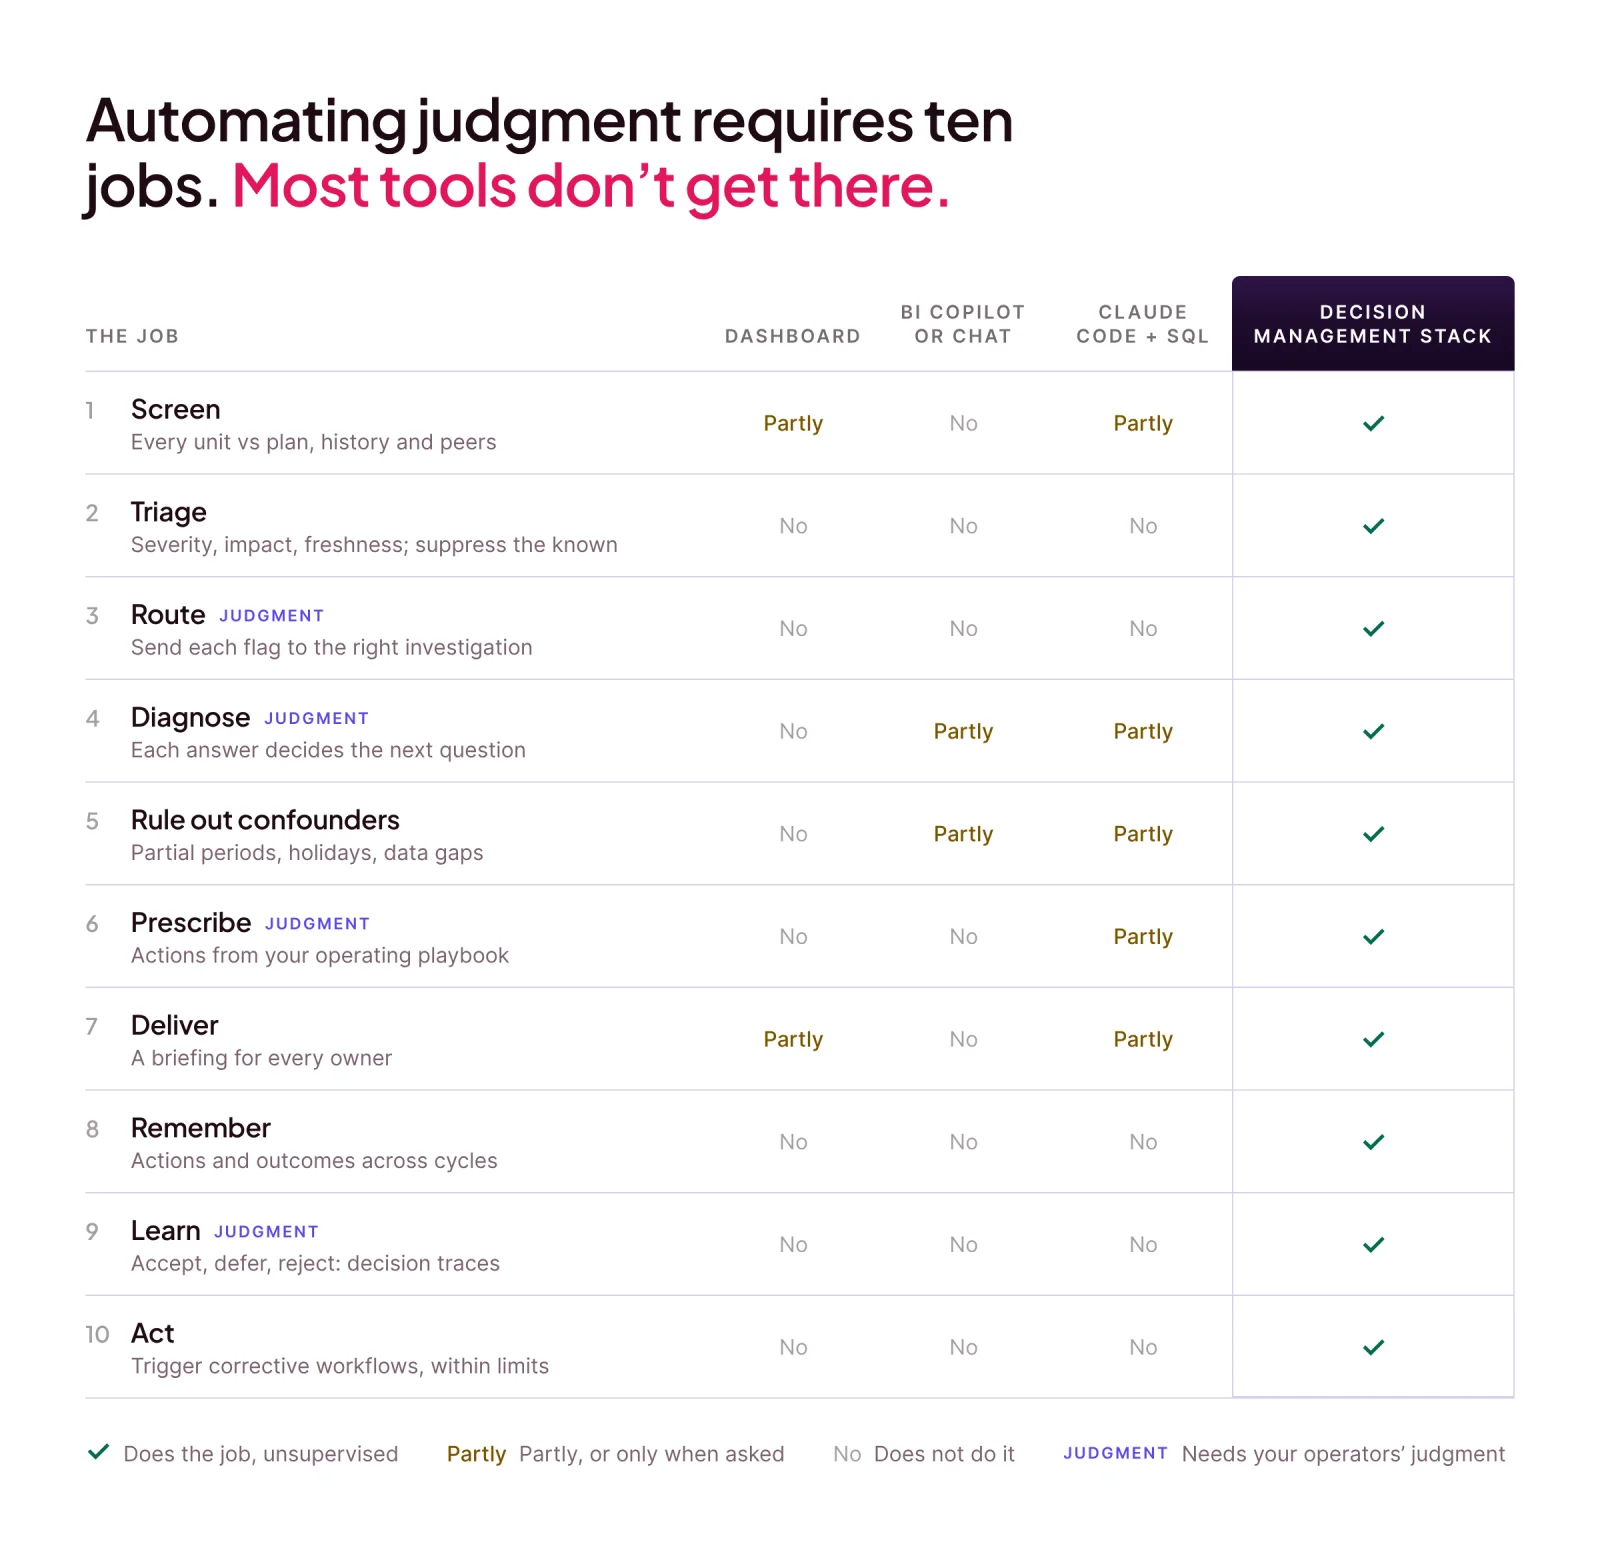
Jobs 3, 4, 6 and 9 are not data problems or model problems. They are judgment problems: which investigation follows which symptom, what counts as trouble, which action fixes which problem. None of that is in your warehouse or in a model's training. It is in your best operators' heads. Getting it out, structuring it and running it everywhere is what the industry now calls a context graph (Part 5 of this series).
The same ten jobs work for any group you manage the same way: stores, sales reps, customer segments, products, warehouses, suppliers or franchisees. Most examples in this series come from store networks only because a chain is the easiest to picture.
Sidebar · When the "location" is a person
REALM is a network of about 600 luxury real estate advisors in more than 20 countries. Its REALM Intelligence service, powered by Scoop, gives each advisor a monthly briefing on their own market: inventory, pricing and days on market in their segment, their production against the network, and wealth signals such as liquidity events. Pilot advisors told REALM which insights were useful and which were noise, and that feedback shaped the guidance. Same ten jobs, different cohort.
04 · Three times the dashboard was wrong
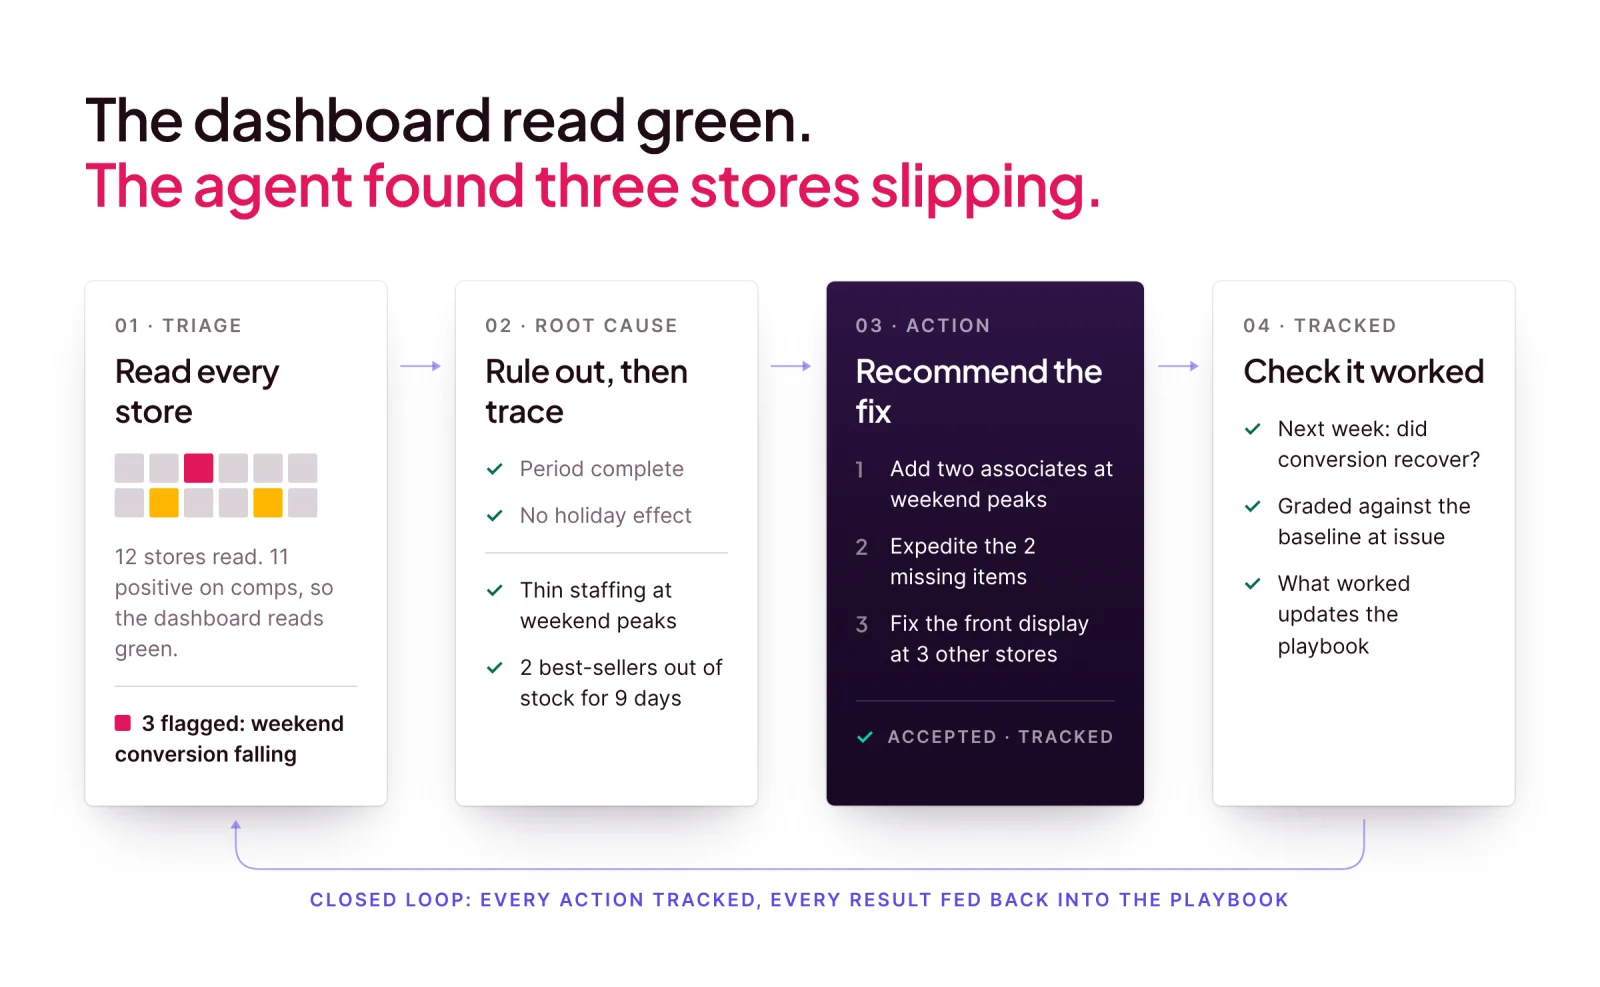
The district that looked healthy
Eleven of a district manager's twelve stores are positive on comp sales. The dashboard reads green. An investigation reads it differently: conversion is falling across the district, weekend traffic at three stores isn't being converted because of thin staffing from noon to 4pm, two best-selling items at one store have been out of stock for nine days, and the front display is inconsistent at three others. The output is three actions with named stores, not a chart. Finding it took five chained questions.
Two emergencies that look the same
In a secondhand retail chain, a drop in new loans and a "false security" pattern (numbers fine today, a lead indicator quietly slipping) can look identical on a dashboard. They need completely different investigations. No model infers which is which. That routing comes from sitting with a COO who has run the business for decades.
The crisis that wasn't
A store shows revenue down 50% on last month. The real explanation: only 14 days of this month have loaded. A tool without discipline flags a crisis with total confidence. A system with discipline checks the period is complete before it says a word.
✓ What works
- Treat the answer as a sequence of questions, not a single query
- Route each symptom to its own investigation, written down by the business
- Rule out the boring explanation first, every time
- Deliver an action with an owner, not a chart
✗ What doesn't
- A chat box that waits for the right question
- Stopping at the first plausible explanation
- The same generic advice for every location
05 · It gets better every week
A dashboard is exactly as smart on its thousandth day as on its first. An AI decision agent is not, because it closes the loop on every recommendation it makes.
- Recommend. Each manager gets specific actions, each with a baseline and a goal.
- Decide. They accept, defer or reject each one, and say why when they reject it.
- Measure. Next week the agent checks what happened against the numbers it saved when the action went out.
- Learn. What worked, what didn't and why goes back into the playbook, so the next recommendation is better.
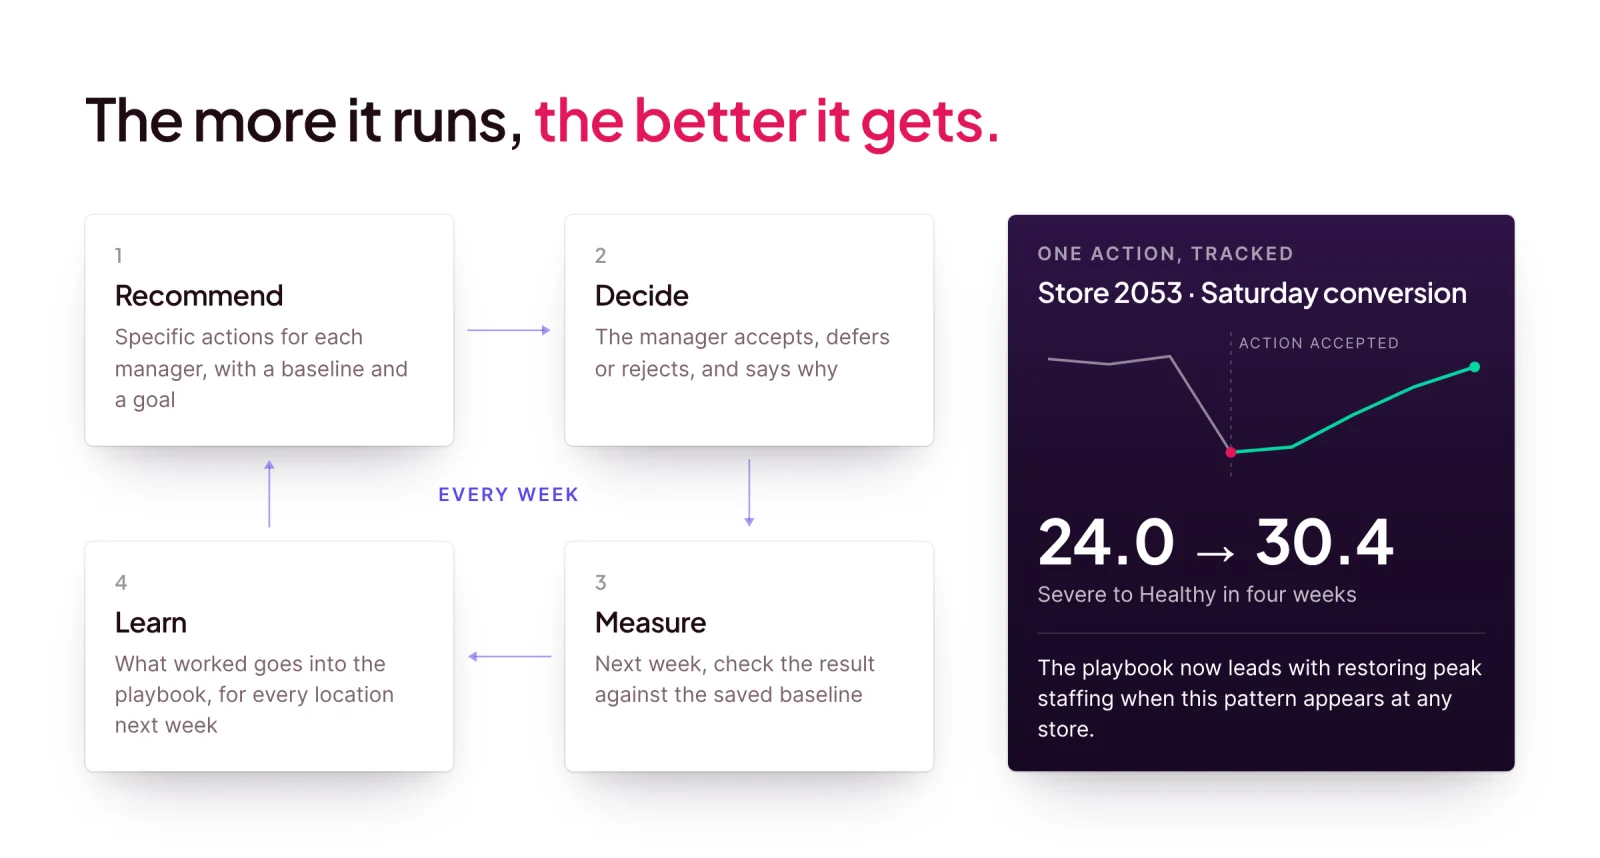
Two things follow, and both matter more than any single insight. First, the agent remembers. An issue that already has an owner and an action isn't flagged again as news, so managers keep reading. Second, what works spreads. When a fix works at one store, the playbook learns it, and every store with the same pattern gets it the following week. Over months the playbook stops being a guess about what works and becomes a record of what did. This is jobs 8 and 9 in the table above, and it is the part most AI analytics tools never build.
Part 3 of this series covers how far to let the agent act on what it learns; Part 6 covers why that record becomes a competitive advantage.
Key takeaways
- BI stops at the chart. Thirty years of analytics made numbers easier to see; none of it made a decision. AI decision management is the layer that does.
- The hard jobs are judgment. Screening is easy. Routing, diagnosing, prescribing and learning live in your best operators' heads, not in your warehouse or a model.
- The closed loop makes it compound. Every accept, defer, reject and result goes back into the playbook, so the agent gets better every week and what works spreads to every location.
The series
- In the future, every manager will have an AI decision agent (you are here)
- Humans like hierarchies for decision making. AI can do it better. (coming soon)
- Agents should earn their autonomy (coming soon)
- Claude Code won't run your business (coming soon)
- A context graph is three layers, not one (coming soon)
- Your judgment is your moat (coming soon)
- The harness, not the model, is the product (coming soon)
- Great production AI runs like clockwork (coming soon)
Sources
- Foundation Capital, AI's trillion-dollar opportunity: Context graphs, December 2025
- Palantir, Connecting agents to decisions, April 2026
- Microsoft Learn, What is Fabric IQ?
- Scoop, It demos well (that's the problem): BEAVER, Spider 2.0 and dbt Labs benchmarks
- REALM, From data to direction: REALM Intelligence
About Scoop
Scoop Analytics builds AI decision management for businesses that run the same metrics across many locations, teams or accounts. Its Insight and Action Factory learns how your best operators read the numbers, investigates every location every week, gives each manager a briefing with what changed, why and what to do, and tracks whether it worked. It runs on the data and BI you already have, with a pilot live in four to five weeks. Scoop is SOC 2 certified and in production across more than 1,000 locations.
See it on your own data: book a discovery call or visit scoopanalytics.com.
Get insights like this every week
Analytics, ops strategy, and product updates. No noise.


Book a discovery call
Reach out to start a two-way conversation about your industry, your performance variations across locations, and whether Scoop is the right fit for you.