Your data is dirtier than your pilot let on
I have spent my career trying to make analytics usable by the people who actually run businesses. I built the products that became Oracle's BI and data warehousing line, then started Birst to move all of that into the cloud. So when AI arrived, I had a hypothesis about where it would help. I was mostly wrong about the easy part.
Here is what I learned the hard way. When an AI analytics tool underperforms, the instinct is to add engineers, sharpen the prompts, and hand it a bigger context window. We did all of that. It got better at the margins. It did not get fixed.
That is not a failure of effort. It is a failure of diagnosis.
The model was never the bottleneck. The warehouse is. And enterprise warehouses are dirtier than any pilot reveals, which is why more prompting, more people, and more tooling keep bouncing off the same wall.
Why doesn't adding engineers and better prompts fix it?
Because engineers can improve the prompt, but they cannot make the warehouse cleaner from the outside. The mess is structural, and it sits underneath the model.
A real enterprise warehouse was not designed in one sitting. It was built by different teams, over different years, with different assumptions:
- Multiple definitions of the same term, because finance and operations never agreed on one.
- Multiple date conventions, because the fiscal calendar and the wall calendar were both encoded by whoever built that table.
- Multiple ways to store the same kind of data, because the transaction table and the balance table both look like they answer the same question.
These are not edge cases. They are the base state of a traditional data warehouse. Nobody built it dirty on purpose. It accreted that way, one well-intentioned decision at a time.
A pilot never shows you this. A pilot runs on a curated subset of clean data, in a controlled environment, reviewed by the people who built it.
The model re-guesses what every column means on every query.
Without a layer that declares the right table, the right aggregation method, and the right date convention once and enforces it every time, the model improvises.
Sometimes it guesses right. Often it does not. And when it guesses wrong, it does not tell you. It hands you a confident number, which is the hidden cost of black-box AI.
Every location diagnosed. Every cycle.
Scoop is AI performance management for distributed businesses. It diagnoses performance at every location, every cycle, and hands every manager a clear action plan.
- Every location, every cycle
- Role-specific action plans
- No prompting required
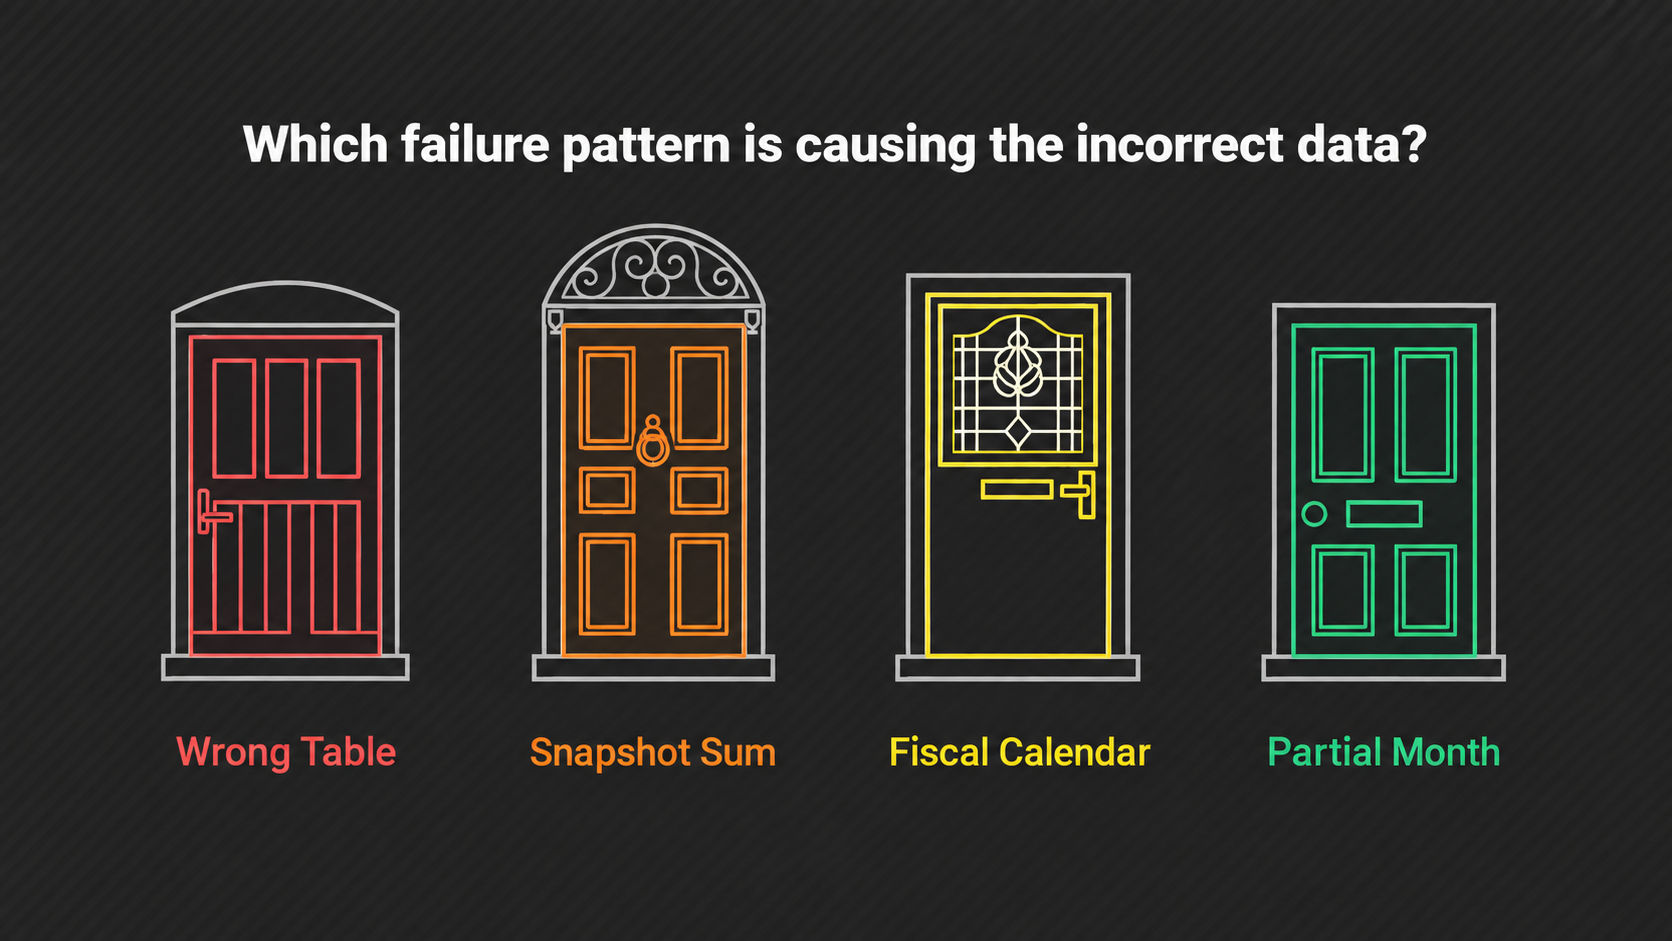
What do the four failure patterns look like?
Each one is a case where the data looks fine, the query runs clean, and the answer is wrong. Most enterprise analytics people have seen at least one of these. Here are all four.
The wrong table. The question is simple: what is our inventory? Two tables could answer it. One sums transaction costs and returns $8M. The other reads the point-in-time inventory balance and returns $5M. Both look like inventory. Only one is.
Without a routing rule that sends inventory questions to the balance table, the $8M answer ships. It looks like a number. It is 60% too high. The model had no way to know which table was authoritative, because that knowledge was never written down, only known by the person who built the schema. This is a base-state property of a traditional data warehouse, not an edge case.
The snapshot sum. Some metrics are balances. Portfolio size, outstanding loans, inventory value. Each one represents a point in time. You never sum a balance across dates.
But warehouses often store daily snapshots. If the model sums a balance across 90 days of point-in-time snapshots, a $10M portfolio reads as $900M. The number is off by 90 times, and nothing about the query looks broken. The model cannot tell a balance metric from a flow metric on its own. It has to be told, and it is not.
The fiscal calendar. Finance says Q1. Operations says Q1. They mean different things. One runs October through December. The other runs January through March. They disagree by three months, and both are correct inside their own department.
Every quarterly comparison that crosses that boundary is quietly off by a full quarter. Nobody notices until two reports collide in a meeting.
The partial month. It is the 17th. The current month has 14 days of data loaded. Last month had 31. A naive comparison shows revenue down 50%, and the model flags a crisis. It is not a crisis. It is a data artifact. The reporting period is not complete.
Without logic that detects an incomplete period and adjusts the comparison, the most common false alarm in enterprise reporting ships every single month. It is the confident wrong number that makes black-box AI so dangerous: it looks right, so it ships.
What is a semantic layer, in plain terms?
A semantic layer is the place where you write down what a term means, which table it comes from, and how to aggregate it. Then every query uses that definition instead of its own guess.
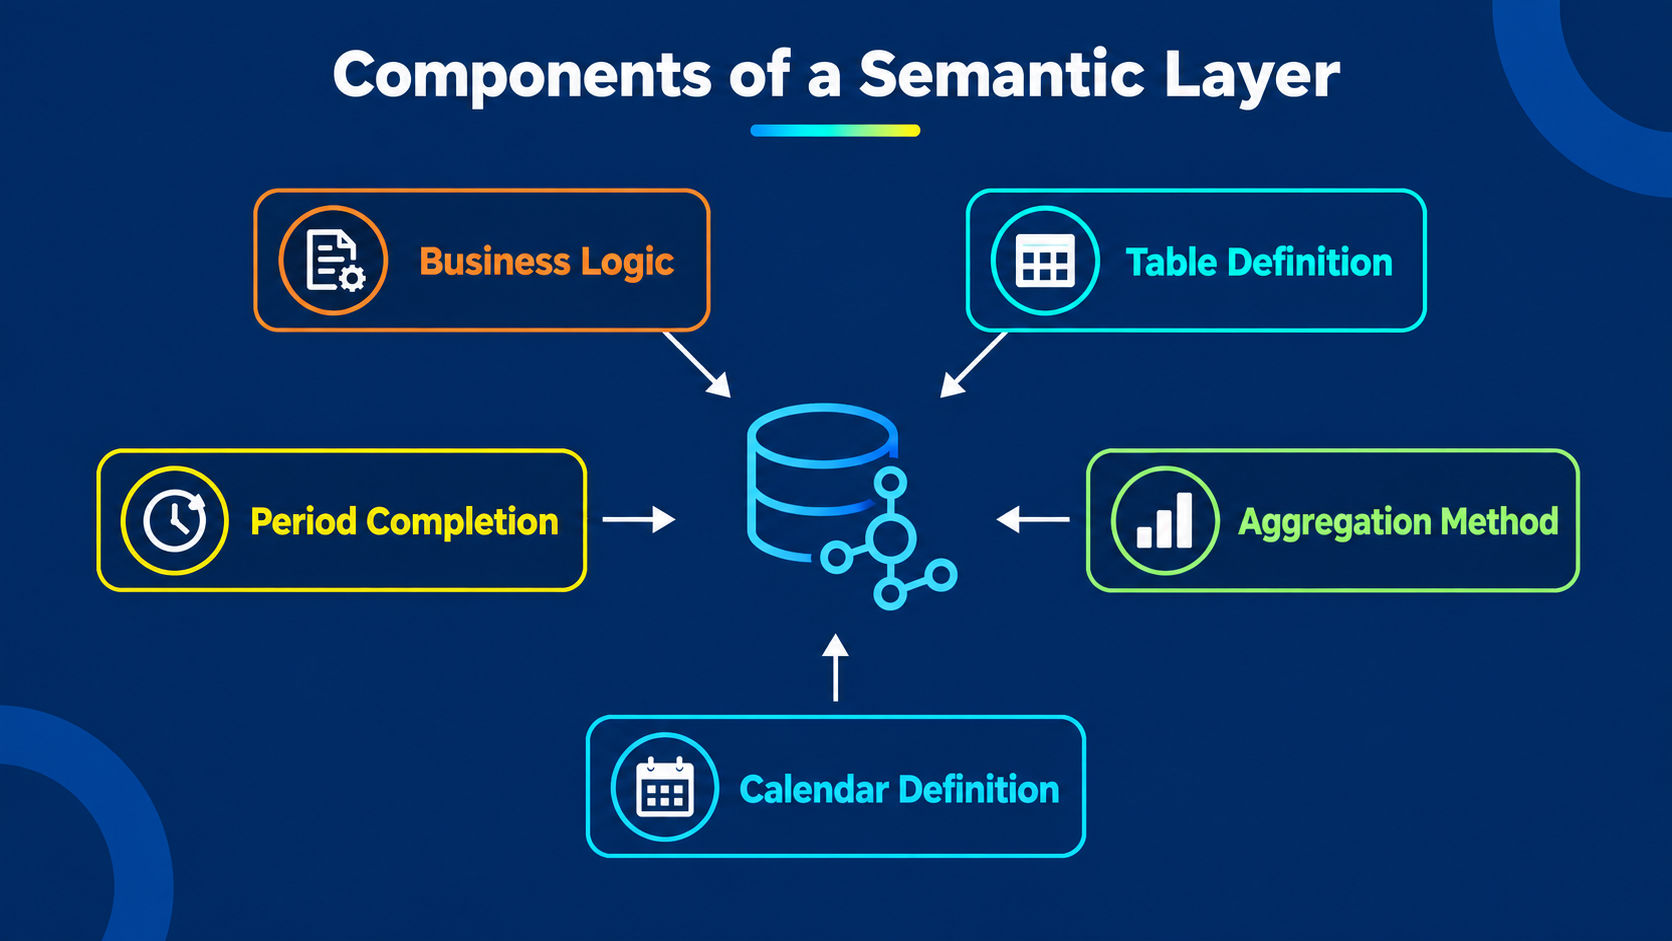
Think of it as the single answer to four questions, declared once and enforced everywhere:
- Which table? Inventory resolves to the balance table, not the transaction table. Always.
- How does it aggregate? A balance is read at a point in time, never summed across snapshots.
- Which calendar? Q1 means one thing, encoded once, applied to every quarterly comparison.
- Is the period complete? A partial month is detected and the comparison is adjusted before anyone sees it.
The fix is more than engineers. Engineers writing better prompts are still handing the model a warehouse full of ambiguity and hoping it resolves each case correctly. A semantic layer removes the ambiguity before the model sees a single row. It is the difference between hoping for the right guess and enforcing the right answer.
Here is the number I keep coming back to. Roughly 85 to 95% of the context of a question is not contained in the question itself. When a VP of sales asks what was different this week versus last week, or which stores were working, there is a mountain of assumed context behind that sentence. It lives in people's heads. It is the tribal knowledge that never reaches the operational analytics layer.
The warehouse holds the rows. The meaning lives in people's heads. That is the gap a semantic layer closes, and it is the same reason most BI projects are doomed to fail. Not because of the technology, but because the business logic was never captured.
If you ask three different people what the death spiral was, you would get three different answers.
A semantic layer picks one and makes it law.
How much does the data layer actually matter?
It matters more than the model. There is a clean benchmark that proves it.
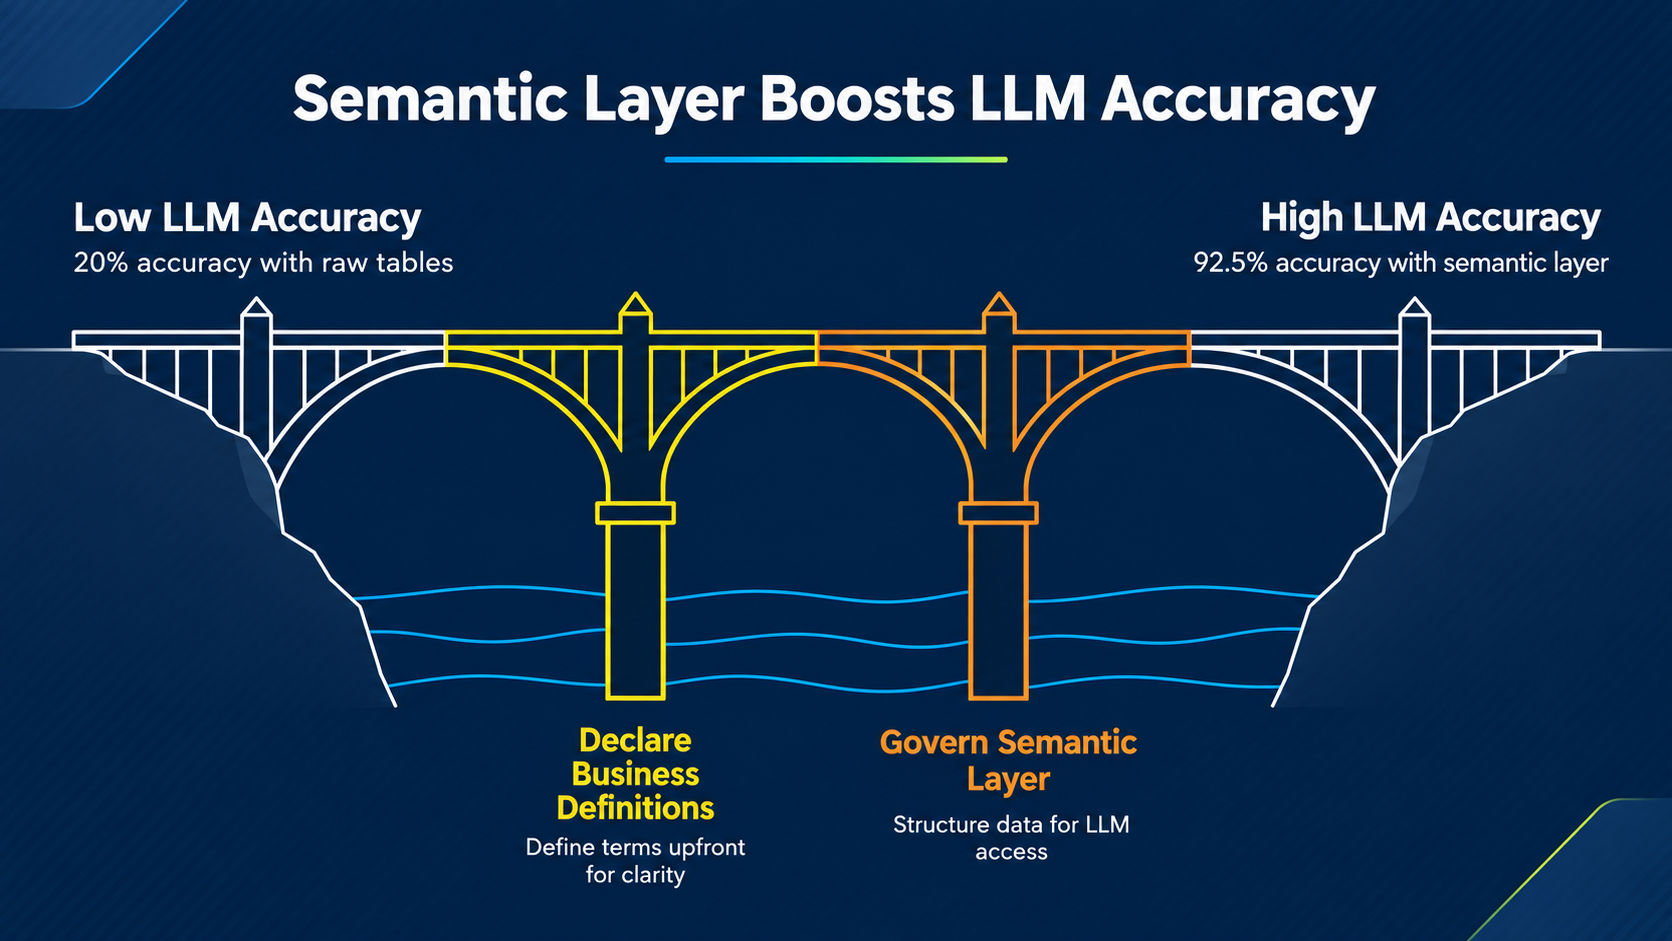
AtScale tested the same large language model against a real enterprise schema, first with access only to the raw tables, then with a governed semantic layer in between. The setup used the TPC-DS dataset and a frontier model, across 40 business questions of varying complexity. The results, reported by AtScale:
- Raw tables only: about 20% accuracy.
- Through the semantic layer: 92.5% accuracy.
Same model. Same questions.
The only thing that changed was whether the business definitions were declared up front. On the hardest category, complex questions against complex schemas, the raw-table system scored 0%. The semantic-layer system scored 70%. That is not a model improvement. It is a data-layer improvement.
The model stopped having to guess. Independent enterprise benchmarks point the same way. On messy private schemas, raw text-to-SQL accuracy collapses, and the failures are usually confident wrong numbers rather than honest refusals. That is what separates a tool that demos well from one that is reliable in daily use.
How we built Scoop to make the answers consistent
When we set out to build Scoop, this is the problem we started from. Not a smarter chatbot. A governed semantic layer between the model and your data, binding every term to the right definition once.
The four failure patterns above are exactly the ones it is built to prevent:
- Inventory resolves to the point-in-time balance table, not the transaction cost table, for every query.
- Balance metrics are never summed across snapshots.
- Partial months are detected and comparisons are adjusted before the model sees the data.
- Fiscal calendars are encoded once and applied everywhere.
The business logic lives in configuration, not in a prompt and not in code that has to be rewritten per question. That is what lets the agentic analytics engine sit on top of your existing BI stack without asking you to rip anything out. It adds interpretation, not another warehouse to migrate to.
The capture is the hard part, and it only happens once. The way I describe the capture to operators is simple. If we sat down while you looked at your BI reports, and I took a tape recorder and recorded everything you thought as you read them, we stick that into the system so it can do that on your behalf.
That is the mechanism. Our team sits with your operators, encodes how they define each metric, and locks those definitions into the layer so the answers stop drifting. The capture happens once, during a hands-on setup, and then it holds.
The payoff is consistency. Five people asking the same question get the same number. Not five internally consistent, mutually wrong answers. One number, traceable to one definition, the same every time.
The model was never the problem. The warehouse was. A semantic layer is what turns a warehouse full of guesses into answers you can trust.
Built for the businesses that run everywhere at once.
Scoop exists to bring best-in-class operational diagnostics to every distributed business, not just the ones big enough to staff a team for it. Meet the people building it.
- Operator-first by design
- Built for distributed teams
- Diagnostics, not dashboards
Frequently asked questions
Why doesn't adding more engineers fix AI analytics accuracy?
Because engineers can improve the prompt but cannot make the warehouse cleaner from the outside. The accuracy problem is structural: the warehouse holds ambiguous definitions, duplicate tables, and conflicting date conventions, and the model guesses which to use on every query. Better prompts still hand the model that ambiguity. The fix is a governed layer that declares the right table, aggregation, and calendar once and enforces it before the model runs. More people writing prompts do not close that gap.
What is a semantic layer and why does it matter for AI?
A semantic layer is where you write down what a term means, which table it comes from, and how to aggregate it, so every query uses that definition instead of guessing. It matters for AI because language models are accurate only when the business context is supplied up front. Without it, the model infers what revenue or inventory means from raw tables and often gets it wrong. With it, the definition is already established. This is the difference between a tool that demos well and one that is reliable in daily use.
Why don't pilots reveal data quality problems?
Because a pilot runs on a curated subset of clean data, in a controlled environment, reviewed by the people who built it. Production is the opposite: full schemas, multiple teams' definitions, real date conventions, and nobody double-checking every answer. The failure patterns, wrong table, snapshot sums, fiscal mismatches, partial months, only surface when real questions hit real tables at scale. The pilot is designed, intentionally or not, to avoid exactly the conditions that break the tool.
What is the difference between a balance metric and a flow metric?
A balance metric represents a point in time: portfolio size, outstanding loans, inventory value. A flow metric accumulates over a period: revenue, units sold, new loans written. You sum flow metrics across dates. You never sum balance metrics, because that double-counts the same value on every snapshot. Summing a balance across 90 daily snapshots turns a $10M portfolio into $900M. A semantic layer encodes which metrics are balances so the model never sums them.
Does a better AI model solve enterprise data problems?
Not on its own. The AtScale benchmark held the model constant and changed only whether a semantic layer supplied the business context. Accuracy went from about 20% on raw tables to 92.5% through the layer. The model did not improve. It stopped guessing. A more capable model still infers meaning from an ambiguous schema and still ships confident wrong numbers. The dominant accuracy lever is the data layer, not the model.
How does Scoop keep everyone's numbers consistent?
Scoop binds each business term to one definition in a governed semantic layer, then resolves those definitions into virtual metrics at query time. Inventory always reads the balance table. Balances are never summed across snapshots. Fiscal calendars are encoded once. Partial months are detected and adjusted. Because the definitions live in configuration and are applied on every query, five people asking the same question get the same number. The engine sits on top of your existing stack, so nothing gets migrated.