
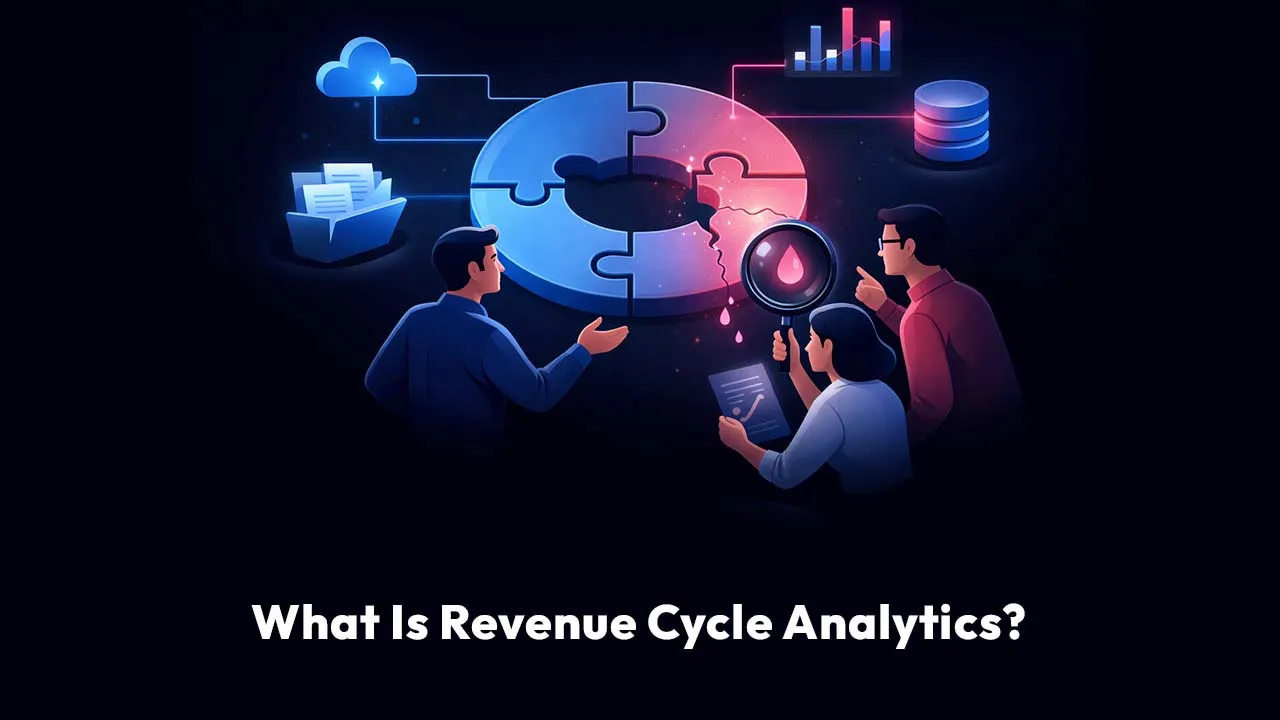
Revenue cycle analytics is the discipline of using operational and financial data to understand, predict, and improve how revenue is earned, captured, and collected—from the moment demand is created to the moment cash hits the bank. It connects process metrics (speed, accuracy, leakage) to financial outcomes (cash flow, margins, write-offs) so operations leaders can fix the real bottlenecks, not symptoms. At Scoop Analytics, we see this as the “last mile” of BI: turning the data you already have into decisions your team can act on.
How does revenue cycle analytics work?
Revenue cycle analytics works by stitching together data from every step of the revenue journey (orders, fulfillment, billing, collections, adjustments, renewals) and turning it into measurable signals: where revenue is delayed, denied, disputed, discounted, or lost. Then it prioritizes actions that improve cash speed, reduce leakage, and make performance predictable—without forcing operations leaders to become part-time data scientists.
What data does revenue cycle analytics use?
Most operations leaders assume “revenue” lives in one system. It doesn’t. It’s scattered.
Revenue cycle analytics typically pulls from:
- CRM and pipeline systems (quotes, renewals, deal terms)
- Order management (orders, backorders, shipments)
- Billing systems (invoices, credits, pricing changes)
- Payment systems (payment dates, partials, chargebacks)
- Collections systems (follow-ups, dispute status)
- Customer success platforms (adoption, risk signals, churn)
- Finance/ERP (journal entries, adjustments, revenue recognition)
The goal is not “more dashboards.” It’s a single story: what happened, why it happened, and what to do next.
What makes revenue cycle analytics different from basic reporting?
Basic reporting says:
- “A/R is up.”
- “Revenue is down.”
- “Collections are slow.”
Revenue cycle analytics answers:
- Which customers are driving the A/R increase?
- Which invoice types are most likely to go past due?
- Which contract clauses are creating disputes?
- Which handoff in the process is creating the delay?
- What should we change this week to reverse the trend next month?
It’s the difference between observing the fire and finding the faulty wiring.
What is revenue analytics, and how is it related?
Revenue analytics is the broader practice of analyzing revenue performance across pricing, product mix, customer behavior, and growth drivers. Revenue cycle analytics is a specialized subset focused on the operational mechanics of getting paid and keeping revenue healthy after the sale.
Think of it like this:
- Revenue analytics: “How do we grow revenue?”
- Revenue cycle analytics: “How do we stop losing revenue we already earned and get paid faster?”
Both matter. But if your revenue cycle is leaky, growth just pours into a bucket with holes.
What problems does revenue cycle analytics solve?
Here’s the uncomfortable question:
If revenue is “earned,” why does it still feel unpredictable?
Because the revenue cycle is full of silent failure modes. Revenue cycle analytics exposes them.
Common problems it solves:
- Slow cash collection and growing A/R
- High dispute or denial rates (claims, invoices, chargebacks)
- Low first-pass billing accuracy (rework and delays)
- Pricing and discount leakage
- Contract term confusion and inconsistent enforcement
- High write-offs, credits, and preventable adjustments
- Forecast instability caused by downstream operational delays
And yes, this applies outside healthcare, too. Any business with invoicing, contracts, subscriptions, or complex billing has a revenue cycle.
Why should business operations leaders care?
Because revenue is not just a finance outcome. It’s an operational outcome.
If your teams are understaffed in billing, if your handoffs are messy, if your process requires tribal knowledge, you’re not just “inefficient.” You are funding your inefficiency with delayed cash.
Revenue cycle analytics gives ops leaders a language to translate day-to-day friction into executive-level impact:
- “This workflow issue adds 11 days to cash.”
- “This exception type causes 38% of disputes.”
- “This customer segment creates 60% of our rework.”
That’s how you get resourcing, process change, and cross-team buy-in.
What does the revenue cycle look like in a modern business?
The exact steps vary by industry, but most revenue cycles include:
- Demand and qualification (lead to opportunity)
- Contracting and pricing (terms, discounts, compliance)
- Order and fulfillment (delivery, acceptance, usage)
- Billing (invoice accuracy, timeliness, format)
- Collections and payment (follow-up, payment methods)
- Adjustments (credits, write-offs, disputes, chargebacks)
- Retention and renewal (expansions, churn prevention)
Revenue cycle analytics maps metrics to each stage so you can pinpoint where revenue slows down or evaporates.
What metrics should you track in revenue cycle analytics?
If you track everything, you fix nothing.
Revenue cycle analytics works best when you select a small set of “command metrics,” then break them down into diagnostic drivers.
What are the core revenue cycle analytics KPIs?
Here are the ones that almost always matter:
- Days Sales Outstanding (DSO)
- A/R aging distribution (current, 30/60/90+)
- First-pass billing accuracy (or clean invoice rate)
- Dispute rate and dispute cycle time
- Collection effectiveness index (CEI)
- Write-off rate and root causes
- Credit and adjustment volume
- Cash application cycle time
- Renewal leakage (if subscription-based)
KPI comparison table
Revenue Cycle Analytics KPI comparison
Use this table to diagnose where cash slows down and what to fix first—one KPI at a time.
Operator-ready
| KPI | What it tells you | Common root causes | Best next action |
|---|---|---|---|
|
DSO
|
How long it takes to collect cash. | Late invoicing, disputes, weak follow-up. | Segment DSO by invoice type and customer. |
|
A/R Aging (90+)
|
Where cash is most at risk. | Unresolved disputes, missing documentation. | Run a “top 20 stuck accounts” war room with owners + deadlines. |
|
First-pass billing accuracy
|
How often you get billing right the first time. | Bad master data, contract ambiguity, manual steps. | Identify the top error categories and add automated validation checks. |
|
Dispute cycle time
|
How long disputes take to resolve. | Slow handoffs, unclear ownership, missing evidence. | Assign category owners and standardize evidence packets. |
|
Write-off rate
|
Revenue you never collect. | Policy gaps, late escalation, preventable errors. | Classify write-offs into preventable vs unavoidable and fix the preventable upstream. |
How do you find revenue leakage with revenue cycle analytics?
Revenue leakage is any gap between what you should have collected and what you actually collect.
And it hides in plain sight.
Where does leakage usually come from?
Common sources include:
- Contract terms not enforced (late fees, minimums, renewals)
- Discounts applied inconsistently
- Usage not billed (especially in consumption models)
- Credits issued to “make it go away”
- Invoices sent late or to the wrong place
- Disputes that linger until they become write-offs
- “Small” adjustments that add up across thousands of transactions
A practical leakage hunt (7-step sequence)
Use this exact sequence to find leakage fast:
- Start with a single month of closed invoices
- Match billed amounts to contract terms (price, frequency, scope)
- Compare invoices to fulfillment or usage (what was delivered vs billed)
- Identify adjustments (credits, write-downs, write-offs)
- Categorize disputes by reason code and owner team
- Rank leakage sources by dollars and frequency
- Fix upstream inputs (master data, terms, approvals) before you add headcount
This is where revenue cycle analytics becomes operational truth.
What does “good” look like?
Operations leaders love benchmarks. But here’s the honest answer:
“Good” depends on your billing model, customer mix, and contract complexity.
A simple subscription business can run a tight, fast revenue cycle.
A complex B2B services business will naturally have more exceptions.
Instead of chasing generic benchmarks, compare:
- your best segment vs your worst segment
- your best quarter vs your worst quarter
- your cleanest invoice type vs your messiest invoice type
Revenue cycle analytics is not about shame. It’s about clarity.
How do you implement revenue cycle analytics?
Implementation is where most teams stall.
Not because they lack data.
Because they lack a clean path from data to action.
Step 1: What question are you answering first?
Pick one “pain question” you can solve in 30 days:
- Why is DSO rising?
- What causes most disputes?
- Which customer segment is the slowest to pay?
- Where are credits coming from?
A focused question prevents analysis paralysis.
Step 2: What are your key entities?
Your analytics will fall apart if these definitions aren’t consistent:
- customer
- invoice
- contract
- product or service line
- payment
- adjustment
- dispute
Agree on definitions early. Put them in writing. Treat them like operational policy.
Step 3: How do you connect data across systems?
Most teams attempt a perfect data warehouse project.
That’s the long road.
A faster route looks like this:
- start with exports from billing + ERP + collections
- build a unified “invoice spine”
- join customer attributes and contract terms
- layer in dispute and adjustment details
- only then add advanced signals like usage or CS activity
The point is momentum.
Step 4: How do you operationalize insights?
Here’s the trap: teams build beautiful dashboards that nobody uses.
Operationalize by creating:
- a weekly “revenue cycle standup” (30 minutes, same agenda)
- a top 10 list of stuck cash and the next action for each item
- owner assignments for dispute categories
- measurable targets tied to process changes, not just outcomes
Step 5: When do you add predictive analytics?
After you can trust the basics.
Once you have stable, consistent history, predictive models can help you answer:
- Which invoices will go overdue before they do?
- Which customers are likely to dispute?
- Which contract structures produce the most leakage?
This is where Scoop Analytics’ approach stands out for operations teams: it doesn’t just surface charts. It automates data preparation, applies machine learning, and then explains results in business language—so you can move from question to action without a long analytics backlog.
Real-world examples (what this looks like in practice)
Let’s make this concrete.
Example 1: DSO rises, but revenue is “fine”
You see DSO climb from 41 to 55 days over two quarters.
A basic report stops there.
Revenue cycle analytics breaks it down:
- 80% of the increase is from one invoice type: multi-site services
- those invoices have a 3x higher dispute rate
- disputes cluster around one clause: acceptance criteria
- disputes correlate with one operational behavior: delayed delivery sign-off
The fix isn’t “collections needs to work harder.”
The fix is:
- standardize acceptance documentation
- require sign-off before invoicing
- add an automated check for missing evidence packets
Cash improves because the process improves.
Example 2: Credits “as a customer love language”
Your credit volume looks small.
But it happens constantly.
Revenue cycle analytics shows:
- credits are concentrated in three customer segments
- 60% of credits are tied to billing confusion
- billing confusion spikes when contract terms are updated mid-cycle
Now you have a clear action:
- lock contract change windows
- standardize how changes appear on invoices
- add proactive customer communication for term updates
That’s revenue analytics and operations working together.
Example 3: Subscription renewals leak quietly
Renewals are “owned” by sales, so ops assumes it’s not their lane.
Revenue cycle analytics reveals:
- customers who had 2+ billing disputes are far more likely to churn
- renewal discounts increase after disputes
- churn rises in segments with slower dispute resolution
Now ops has leverage:
- reducing dispute cycle time becomes a retention strategy
- revenue cycle analytics becomes a growth lever, not a cleanup effort
What tools do you need?
Tools matter, but less than you think.
At minimum, you need:
- a way to consolidate data (warehouse, lake, or analytics platform)
- a consistent metric layer (definitions, calculations)
- a workflow for action (tasks, owners, follow-up)
Nice-to-haves:
- automated anomaly detection (flag spikes in disputes or credits)
- predictive risk scoring (late pay, dispute likelihood)
- natural language access (so leaders can ask “why is cash slow?” and get answers)
Scoop Analytics is built for that last category of need: helping non-technical leaders ask natural questions and get explainable, actionable answers—fast.
What are common mistakes operations teams make?
Here are the patterns we see over and over:
- Mistake 1: Treating revenue cycle analytics as a finance project
It’s an operations project with finance outcomes. - Mistake 2: Measuring outcomes without measuring drivers
DSO is an outcome. Invoice accuracy and dispute cycle time are drivers. - Mistake 3: Tracking averages
Averages hide the mess. Segment everything. - Mistake 4: Building dashboards without ownership
If nobody owns the metric, nobody fixes the metric. - Mistake 5: Ignoring contract and master data quality
Bad input data guarantees bad decisions.
Related content group: questions leaders ask next
If you’re building a content cluster around “what is revenue cycle analytics,” these are the natural follow-on questions operations leaders search for:
- What are the most important revenue cycle analytics KPIs?
- How do I reduce DSO without hiring more collectors?
- How do I reduce billing disputes?
- How do I find and prevent revenue leakage?
- What is the difference between revenue analytics and revenue cycle analytics?
- How do I build a revenue cycle dashboard executives will trust?
- How do predictive models improve revenue cycle performance?
FAQ
What is revenue cycle analytics in simple terms?
Revenue cycle analytics is using data to understand how money moves through your business—from billing to payment—and to spot where it slows down or leaks. It helps you reduce errors, resolve disputes faster, collect cash sooner, and prevent write-offs by turning process problems into measurable, fixable actions.
How is revenue cycle analytics different from revenue analytics?
Revenue analytics focuses on how to grow revenue through pricing, product, and customer strategy. Revenue cycle analytics focuses on capturing and collecting revenue efficiently after the sale by improving billing accuracy, dispute resolution, collections performance, and cash flow predictability.
What should I measure first?
Start with:
- DSO
- A/R aging (especially 90+)
- dispute rate and dispute cycle time
- first-pass billing accuracy
- write-off rate
Then segment by customer, invoice type, product line, and region to find the real drivers.
How do I implement revenue cycle analytics if my data is messy?
Don’t try to fix everything at once.
- Choose one business question (like “why is DSO rising?”)
- Build an invoice-level dataset for one quarter
- Standardize key definitions (customer, invoice, dispute, adjustment)
- Create a weekly review rhythm with owners and next actions
- Improve data quality where it directly affects decisions
Messy data is normal. No momentum is optional.
What results should I expect?
If you operationalize insights (not just report them), common outcomes include:
- faster cash collection
- fewer billing errors and rework
- reduced disputes and quicker resolutions
- lower write-offs and adjustments
- more reliable forecasting
Conclusion
If you’re asking “what is revenue cycle analytics,” you’re probably feeling something already: revenue is too important to be this opaque.
Revenue cycle analytics gives you operational truth behind financial outcomes. It turns “we think” into “we know.” And it turns “we know” into “here’s exactly what we do next.”
Because the real win isn’t a prettier dashboard.
It’s faster cash, less leakage, fewer surprises—and a revenue engine that finally behaves like an engine instead of a mystery.
Read More
- Why Your Revenue Growth is Stuck (And How to Fix It Fast)
- The Era of Unpredictable Revenue: Lessons for GTM Transformation
- The Importance of CRM Data Enrichment for Revenue Growth
- How Revenue Teams are Using Gong + Scoop Together to Transform Conversation Data into Strategic Insights
- How Does Sales Analytics Increase Revenue?


