
You don’t need more dashboards.
You need more clarity.
Have you ever wondered why two teams can have the same headcount, the same tools, and the same goals… and still deliver wildly different results?
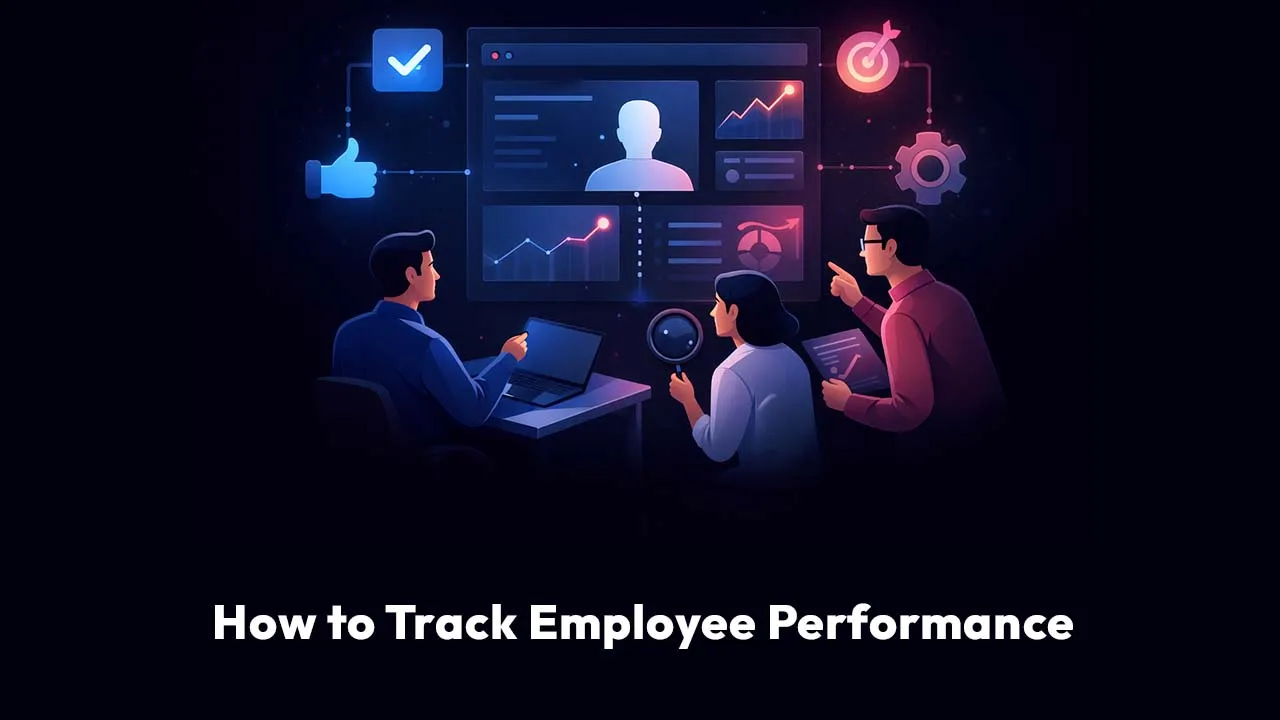
Let’s break down how to track employee performance in a way that improves execution, builds trust, and actually moves your metrics—with a modern analytics layer (including Scoop Analytics) that helps you get from “numbers” to “next steps” faster.
What does “employee performance” mean in a modern business?
Employee performance is the measurable contribution a person makes toward business outcomes through the quality, speed, reliability, and impact of their work. It includes what they deliver (results), how they deliver it (behaviors and collaboration), and how consistently they meet expectations over time—especially under real-world constraints and shifting priorities.
Here’s the trap: many companies try to measure performance without defining it. They end up tracking activity (busy-ness) instead of outcomes (impact). That’s how you get “high effort” teams with flat results.
So before we talk about tools, let’s talk about the system.
How does tracking employee performance work?
At its best, performance tracking works like a feedback loop:
- Define outcomes (what success looks like)
- Choose signals (tracking key performance indicators + leading indicators)
- Create a cadence (weekly check-ins, monthly reviews, quarterly goals)
- Diagnose gaps (skill, process, clarity, capacity, tools)
- Act fast (coach, remove blockers, redesign workflows)
- Repeat (performance is a system, not an event)
If you’re only doing step #1 and step #3 once a year… you’re not tracking. You’re documenting history.
What is the biggest mistake leaders make when tracking employee performance?
They confuse visibility with control.
They add monitoring tools, time tracking, or more KPIs—hoping the numbers will force better execution.
But performance doesn’t improve because people feel watched. Performance improves when people feel clear, supported, and accountable.
So the goal isn’t “collect more data.”
The goal is “make better decisions.”
And that’s where many operations teams stall: they do collect data, but it’s scattered across HR systems, ticketing tools, spreadsheets, time trackers, and BI dashboards—so the “why” is buried. Platforms like Scoop Analytics are designed to close that gap by letting leaders ask questions in plain business language and get explanations they can act on without waiting for a custom report.
What should you track when measuring employee performance?
You want a balanced set of measures:
- Outcome metrics: results that reflect business impact (revenue, cycle time, quality)
- Quality metrics: defects, rework, customer satisfaction, compliance
- Throughput metrics: volume delivered per unit time
- Reliability metrics: on-time delivery, SLA adherence, predictability
- Collaboration and operating health: handoffs, responsiveness, peer feedback, knowledge sharing
- Leading indicators: early signals that outcomes are about to change (pipeline health, backlog age, first-response time)
Here’s a rule that saves careers:
If a metric can be “won” without the business winning, it’s a dangerous metric.
How do I choose tracking key performance indicators for each role?
Start with a simple template:
Step 1: Identify the role’s “job to be done”
Ask: What business problem does this role exist to solve?
Examples:
- Customer support: reduce customer friction and retain revenue
- Accounts receivable: accelerate cash collection, reduce write-offs
- Warehouse ops: ship accurately and on time with minimal cost
- Sales development: generate qualified pipeline efficiently
Step 2: Choose 1–3 outcome KPIs
Then add 2–4 leading indicators.
Step 3: Define “good” in plain language
Numbers without expectations create anxiety.
Expectations without numbers create debate.
Use both.
Step 4: Add an “explanation layer”
This is the step most leaders skip.
It’s not enough to see that “cycle time increased 18%.” You need to know:
- Which work type drove the increase?
- Which handoff slowed down?
- Whether the change is seasonal, staffing-related, or process-related
- What action will reverse it fastest
This is exactly the kind of “last mile” analytics work Scoop Analytics is built for—connecting messy operational data, applying explainable machine learning, and returning business-language answers like: “Cycle time rose because approvals doubled in Region B after policy changes, and rework increased in two teams due to missing intake fields.”
What are examples of performance KPIs by department?
Below is a practical comparison table you can adapt. This is not “the list.” It’s a starting point.
Notice what’s missing? Vanity metrics.
The point isn’t to measure everything. It’s to measure what changes decisions.
How do you track employee performance without killing morale?
This is where most performance tracking systems fail.
People don’t resist measurement. They resist unfair measurement.
What does “fair” performance tracking look like?
1) Metrics are a mirror, not a weapon
If metrics only show up when someone is in trouble, metrics become scary.
Instead:
- review metrics when things are good
- celebrate improvements
- treat dips as problem-solving moments
2) Coaching is separate from compensation
When every check-in feels like a salary negotiation, you get defensive behavior and low honesty.
Create a coaching cadence that’s frequent and low-stakes.
3) You measure the system, not just the person
If performance drops, you don’t just ask, “What’s wrong with them?”
You ask, “What’s happening around them?”
Scoop Analytics supports this mindset by helping you connect performance changes to operational drivers—process steps, workload mix, staffing patterns, handoffs—so you can fix root causes instead of blaming symptoms.
4) You avoid “activity-only” measurement
Hours logged and keyboard activity can be useful for capacity planning in some roles. But as a primary performance measure, it’s a fast path to mistrust—especially for knowledge work.
How do I implement a performance tracking system step-by-step?
Here’s a leader-friendly sequence that works in real organizations.
Step 1: Build a scorecard draft
For each role:
- 1–3 outcome KPIs
- 2–4 leading indicators
- 1–2 quality controls
- a written definition of “excellent,” “meets,” “needs support”
Keep it simple. Alignment first.
Step 2: Run a 30-day baseline
Before you judge anything, you need a baseline.
Use this period to answer:
- Are metrics available and accurate?
- Are definitions consistent across managers?
- Do employees understand what’s being tracked and why?
Step 3: Create a weekly coaching cadence
15–30 minutes. Same structure every time:
- What went well?
- What changed in the numbers?
- What got in the way?
- What’s the plan for next week?
- What support do you need from me?
Step 4: Hold monthly “system reviews”
This is not about individuals. It’s about process.
Ask:
- Which KPI moved the most?
- Where are bottlenecks appearing?
- Which team is carrying hidden load?
- What should we improve first?
Step 5: Use analytics to explain and prioritize
This is where leaders save serious time.
Instead of manually slicing spreadsheets to understand why a KPI moved, you want a workflow where you can ask:
- “Why did first response time spike last week?”
- “Which queue is driving the backlog?”
- “Is this staffing, seasonality, or process?”
This is the practical value of Scoop Analytics: you can move from questions to explanations quickly, even when data lives across different systems.
How do you use tracking key performance indicators to diagnose performance issues?
When a KPI drops, don’t jump straight to conclusions.
Use a simple diagnostic tree:
Is it clarity?
- Are expectations documented?
- Are priorities stable?
- Does the person know what “good” looks like?
Is it capability?
- Do they have the skills for the scope?
- Is training missing?
- Is feedback specific enough to act on?
Is it capacity?
- Too much work?
- Too many interruptions?
- Competing priorities?
Is it process?
- Broken handoffs?
- Unclear ownership?
- Rework loops?
Is it tooling/data?
- Wrong inputs?
- Missing automation?
- Poor visibility?
Operations leaders win because they don’t stop at the person. They fix the system.
What does a great performance dashboard look like?
Not “beautiful.” Useful.
A great dashboard:
- answers 3–5 operational questions
- highlights trends, not noise
- shows context (targets, baselines, seasonality)
- connects leading indicators to outcomes
- makes accountability visible
Example dashboard questions
- Are we on track this month?
- Where is performance drifting?
- Which process step is the bottleneck?
- Who needs help this week?
- What fix delivers the biggest lift?
If your dashboard can’t answer those, it’s entertainment.
How do we scale performance tracking across the business?
Scaling is where organizations break.
Every department tracks differently, definitions drift, managers spend hours prepping reports, and nobody trusts the numbers.
To scale, you need:
A shared KPI dictionary
Define:
- metric formulas
- data sources
- refresh cadence
- ownership
A standard operating rhythm
- weekly coaching
- monthly system reviews
- quarterly goal resets
A faster path from data to decisions
This is the “last mile” problem again.
You can have a modern BI stack and still struggle to answer simple questions quickly because the analysis queue is long and the data prep never ends.
Scoop Analytics is designed to complement what you already have by automating data prep, applying explainable ML, and delivering business-language answers so performance tracking becomes faster, more consistent, and easier to operationalize.
How do you track performance for remote and hybrid employees?
The principles don’t change. The signals do.
What to emphasize
- outcomes and deliverables
- responsiveness and handoff reliability
- clarity of written communication
- predictability (meeting commitments)
What to avoid over-weighting
- “online presence” metrics
- assumptions about time-on-task
- invasive monitoring
Remote work punishes vague expectations.
It rewards clarity and cadence.
FAQ
What is performance tracking?
Performance tracking is the ongoing process of measuring employee contributions using outcomes, leading indicators, and qualitative feedback, then using that information to coach improvement, remove blockers, and align work with business goals.
How often should I track employee performance?
Weekly for coaching signals, monthly for trend review, and quarterly for strategic alignment. Annual reviews alone are too slow to improve performance in real time.
What are the best tracking key performance indicators?
The best tracking key performance indicators are role-specific, tied to business outcomes (revenue, quality, cycle time, retention), supported by leading indicators (pipeline health, backlog age), and protected by quality controls (defect rate, compliance exceptions).
How do I track employee performance without micromanaging?
Focus on outcomes and reliability, keep metrics transparent, and use a consistent coaching cadence. Ask “What’s blocking progress?” more than “Why weren’t you online?”
What if people game the metrics?
If metrics are gameable, it’s a design issue. Balance individual and team KPIs, add quality controls, and choose KPIs where winning the metric requires winning for the business.
Conclusion
If you’re serious about how to track employee performance, don’t start by buying more software or adding more KPIs.
Start by defining success clearly, choosing a handful of meaningful signals, and creating a rhythm that turns performance tracking into better decisions every week.
And when you’re ready to scale—when data is scattered and the “why” takes too long to find—solutions like Scoop Analytics help you close the loop faster by turning operational performance data into business-language explanations leaders can actually act on.
Read More
- How to Measure Employee Performance?
- How Do You Measure Employee Performance?
- What Type of Performance Measure Addresses Patient Satisfaction?
- How to Measure Social Media Marketing Performance
- How to Measure SEO Performance


