What Is Augmented Analytics?

What Is Augmented Analytics?

Augmented analytics is the use of enabling technologies (specifically machine learning and natural language processing) to enhance human intelligence and automate data preparation, insight discovery, and sharing.

It transforms business users into "data scientists" by allowing them to ask complex "why" questions in plain English and receive deep, investigative answers.

Why You Should Care About Augmented Analytics

Have you ever looked at a perfectly designed dashboard, seen a massive red dip in your conversion rates, and realized you have absolutely no idea what to do next?

You aren't alone.

For years, we’ve been sold the dream of "data-driven decision-making", but the reality is often "data-drowning".

Traditional business intelligence (BI) is essentially a rear-view mirror.

It tells you what happened yesterday, but it leaves the "why" entirely up to your imagination; or worse, a three-day wait for a data analyst to run a manual query.

Augmented analytics changes the fundamental physics of this process.

Instead of you digging through data to find a story, the system investigates the data for you.

It uses augmented intelligence to scale your expertise across millions of rows of data in seconds.

Dashboards shows you WHAT.
Domain Intelligence finds the WHY.

Autonomous investigations. Executive-ready reports. No extra headcount.

See how it works

What is Augmented Intelligence vs. Traditional AI?

When people ask, "What is augmented intelligence?" they are often looking for the bridge between "scary automation" and "human expertise."

  • Traditional AI: Often aims to replace human decision-making with a "black box" algorithm.
  • Augmented Intelligence: Focuses on enhancing the human. It’s about putting a PhD-level data scientist in your pocket who understands your specific business context.

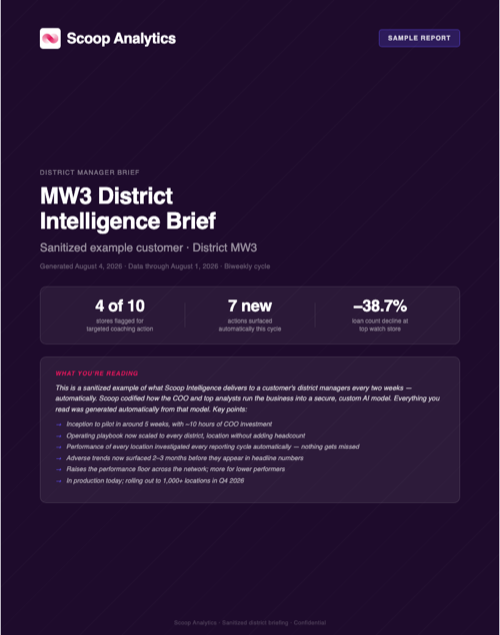
We’ve seen it firsthand: When a COO uses augmented AI, they don't lose control. They gain a superpower. They can suddenly "see" into 1,200 store locations simultaneously, identifying root causes that would take a human team weeks to uncover.

How Does Augmented AI Work in Modern Operations?

The secret to moving from "seeing data" to "taking action" lies in a specialized architecture.

At Scoop Analytics, we call this the Agentic Analytics Architecture.

It isn't just one algorithm; it’s a coordinated team of digital experts working on your behalf.

To understand what is augmented AI in a practical sense, you have to look under the hood.

Most "AI" tools just write a SQL query and give you a chart.

True augmented analytics follows a three-layer process:

1. Automated Data Preparation:

The system automatically cleans your data, handles missing values, and bins variables so they actually make sense for analysis.

2. Explainable ML Model Execution:

It runs sophisticated models (like J48 Decision Trees or EM Clustering) to find patterns.

3. The Business Translation Layer:

This is where the magic happens.

The AI takes those complex 800-node decision trees and translates them into a consultant-quality executive summary in plain English.

Comparison: Traditional BI vs. Augmented Analytics

Feature Traditional BI (Tableau/PowerBI) Augmented Analytics (Scoop)
Primary Goal Visualize "What" happened Investigate "Why" it happened
User Requirement SQL or data visualization skills Natural language (English)
Time to Insight Hours or days of manual digging 2–3 minutes of autonomous reasoning
Scaling Limited by analyst headcount Unlimited concurrent investigations
Output Static dashboards Prioritized action recommendations

Why "Domain Intelligence" is the Final Frontier

If augmented analytics is the engine, Domain Intelligence is the steering wheel.

Generic AI is like a smart person who doesn't know your industry.

They can do math, but they don't know that a "15% churn rate" in enterprise software is a disaster, while "15% table turnover" in a restaurant is a metric for success.

True Domain Intelligence involves encoding your expertise into the system.

  • You define the patterns: Tell the system what a "healthy" store looks like.
  • You set the thresholds: Define when an anomaly is worth a multi-step investigation.
  • The system learns your language: It begins to understand your specific business terminology and definitions through your feedback.
Would you rather have a dashboard that shows your revenue is down, or an autonomous investigation that tells you why it's down, which segment is responsible, and what three actions you should take by 9:00 AM?

Practical Applications for Business Leaders

How do you actually use this?

It isn't just about "asking questions".

It's about operationalizing intelligence across your entire operation.

1. Multi-Location Retail

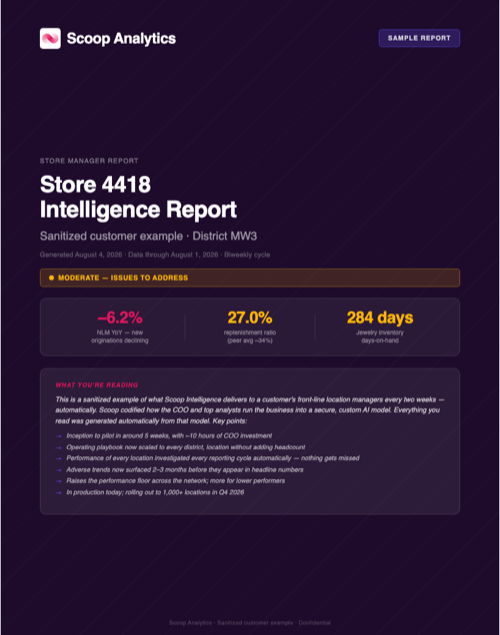
A national chain with over a thousand locations cannot have a senior operator review each store's performance every week.

With augmented analytics, every location gets screened autonomously across multiple analytical lenses in parallel.

The system flags anomalies and investigates automatically, producing findings that explain not just which stores are underperforming but which specific variables are driving it.

Management gets an executive-ready investigation on Monday morning, not a spreadsheet to dig through.

Dashboards show you the problem.

Augmented analytics tells you why the problem exists and what to do about it.

2. Hotel and Property Management

A management company overseeing a hundred or more properties faces the same problem in a different form.

Every property is its own micro-economy with its own:

Aggregated reports miss the nuance.

Augmented analytics lets a COO or VP of Revenue see across every property simultaneously, with the system identifying which locations are developing issues below the surface and why:

  • Booking lead times
  • Channel mix shifts, and
  • Rate variance

Together, these signal a property moving in the wrong direction before the financials confirm it.

3. Real Estate Intelligence

A luxury brokerage managing hundreds of agents operates on a multi-source data environment:

  • CRM
  • Listing data
  • Public market intelligence
  • Transaction history

The challenge isn't access to data.

It's making sense of it at scale.

Augmented analytics creates an automated intelligence layer that continuously processes data across all sources.

Leadership sees what the data actually says about:

  • Market conditions
  • Pipeline health, and
  • Performance patterns

All of this, without waiting for someone to build a report.

Stop reading reports.
Start getting answers.

See how Domain Intelligence works for your operation in a 30-minute demo.

Frequently Asked Questions about What is Augmented Analytics

What is the difference between augmented analytics and a standard chatbot?

A standard chatbot (like ChatGPT) often doesn't have access to your live enterprise data and can "hallucinate" facts.

Augmented analytics for analytics is deterministic; it is grounded in your actual data and uses statistical models (like decision trees) that are fully auditable.

Do I need to hire data scientists to use augmented analytics?

No. The goal of augmented intelligence is to democratize data science.

It allows your existing operations managers and business analysts to perform PhD-level investigations using the spreadsheet skills they already have.

Is my data secure?

Enterprise-grade augmented analytics platforms use "Secure by Design" principles, often including SOC 2 Type II compliance and the ability to analyze your data "in place" without moving it to a separate warehouse.

The Surprising Fact: Dashboards are Actually Slowing You Down

Here is the truth:

The more dashboards you build, the more questions you create.

Every chart leads to a "why," which leads to a request to the data team, which leads to a bottleneck.

Companies with "perfect dashboards" often take 40x longer to reach a decision than those using autonomous augmented analytics.

In 2026, the competitive advantage doesn't go to the leader with the most data.

It goes to the leader who can investigate that data the fastest.

What is augmented analytics? It is your invitation to stop querying and start discovering.

It is the difference between an AI that "guesses" and an AI that "investigates".

Conclusion

The era of relying solely on static dashboards to run a business is coming to an end.

While traditional BI tools are excellent at showing what happened, they fail to address the critical "last mile" of analytics: the why.

Augmented analytics, powered by augmented intelligence, bridges this gap by transforming data from a passive report into an active, autonomous investigator.

By implementing Scoop Analytics, business operations leaders can move beyond manual querying and embrace a future defined by:

  • Encoded Expertise: Capturing decades of executive knowledge in a single Domain Intelligence platform that scales across the entire organization.
  • Autonomous Reasoning: Utilizing a multi-step Agentic Analytics Architecture that tests hypotheses and identifies root causes in minutes, not days.
  • Democratized Data Science: Empowering any user with spreadsheet skills to perform high-level data preparation and machine learning analysis.
  • Actionable Intelligence: Shifting the focus from simply seeing anomalies to receiving prioritized recommendations and scores that can be pushed directly back into operational systems like CRM.

Ultimately, augmented AI doesn't replace the human leader; it amplifies them. It provides the clarity needed to act decisively in a complex, fast-moving environment.

Read More

What Is Augmented Analytics?

Scoop Team

At Scoop, we make it simple for ops teams to turn data into insights. With tools to connect, blend, and present data effortlessly, we cut out the noise so you can focus on decisions—not the tech behind them.

Subscribe to our newsletter

Thank you! Your submission has been received!
Oops! Something went wrong while submitting the form.

Frequently Asked Questions

No items found.