
What Business Intelligence Platforms Miss About Analytics
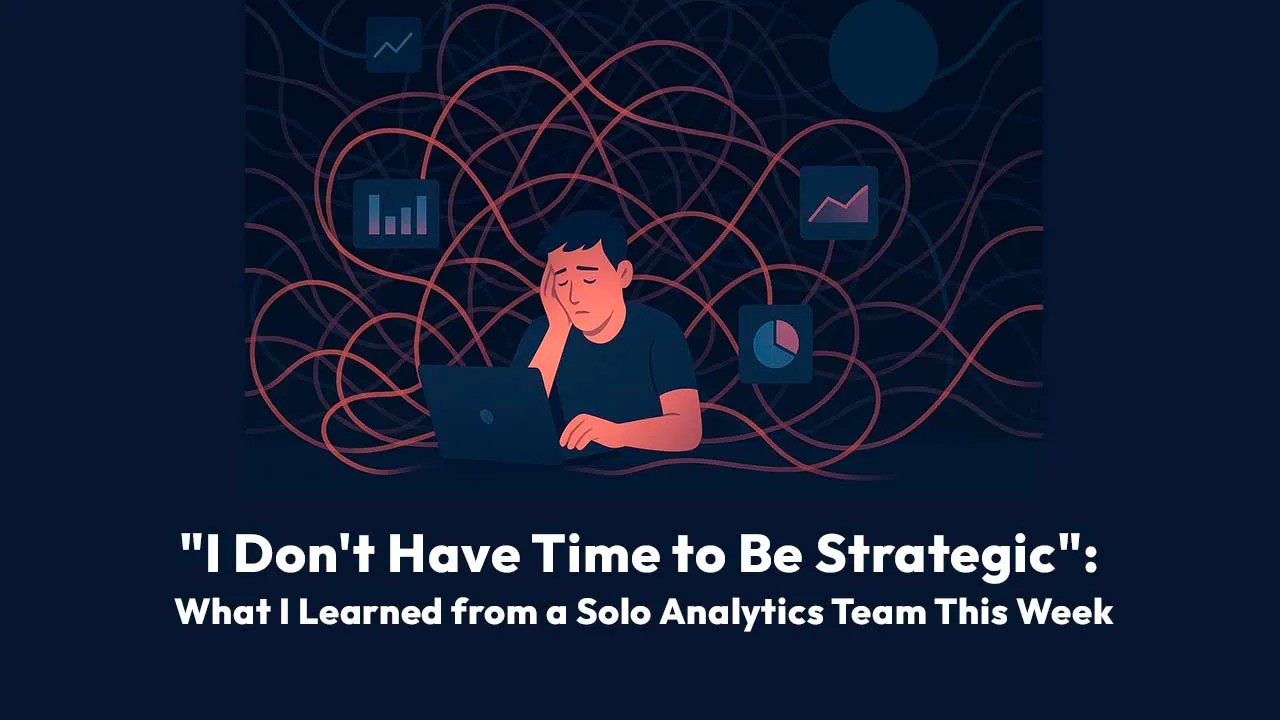
This week I sat in on a demo with an analytics engineer at a B2B SaaS company serving the nonprofit sector. About 10 minutes into our conversation, he said something that perfectly encapsulated a crisis I'm seeing across the industry:
"I don't have time to build pipelines and push data to different systems, do analysis, build decks, be strategic, right?"
That sentence—delivered with equal parts exhaustion and resignation—stopped me in my tracks. Here was someone hired to be strategic, to uncover insights that drive business decisions, essentially saying: I'm drowning in plumbing work and have no time to actually think.
The Impossible Job Description
Let me paint the picture of this professional's reality (details changed to protect confidentiality):
He's the sole analytics resource for his company's entire customer organization. His mandate spans everything from marketing attribution through retention analysis. He's expected to:
- Build and maintain data pipelines
- Reconcile data from three different product instances (his company grew through acquisitions)
- Create mapping tables to unify disparate customer IDs
- Run complex analyses on customer behavior
- Build executive presentations
- Predict churn in an inherently unpredictable customer base (nonprofits with high volunteer turnover)
- Oh, and be "strategic"
When he mentioned recently spending an enormous amount of time analyzing what features drive retention, he added almost as an afterthought: "It took forever."
That's not a complaint about the complexity of the analysis. It's resignation about the absurdity of the process.
The Data Mapping Tax
One moment in our conversation particularly struck me. He was explaining his data infrastructure challenge—a problem I'm betting is familiar to anyone working at a company that's grown through acquisition:
"I have to tie... these are the things that I see that slow me down, because now I have to go get this new data source. I got to write some code to tie... we have three instances of Pendo, each one has a different unique ID account from Pendo... I created this master mapping table."
Think about that for a moment. This person has curated, production-quality datasets sitting in BigQuery. His company has invested in the modern data stack—DataForm for transformations, scheduled pipelines, and what most people would consider a proper business intelligence platform setup. They did everything "right."
But he still spends significant time writing code to map Product A's customer ID to Product B's customer ID to the Salesforce ID that everything ultimately needs to roll up to.
This is the data mapping tax—the invisible cost of operating in reality rather than in architectural diagrams. And it's eating his strategic capacity alive.
The Churn Analysis That Broke My Heart
Later in the call, we got to talking about churn prediction. This company serves nonprofits—organizations with limited budgets, volunteer workforces, and constant turnover. His team desperately needs to understand retention patterns, but the inherent volatility of the customer base makes traditional analysis challenging.
His words here were telling:
"If you know anything about nonprofits, they have limited budgets and a lot of volunteers, AKA a lot of turnover. So churn, there's not always a rhyme or reason, because humans aren't rational actors... I feel like I have boiled the ocean and haven't been able to figure anything out besides kind of like these few key things that just everybody knows."
"Boiled the ocean" is such a perfect phrase. He's done the work. He's run the analyses. He's looked at the data from every angle. And despite all that effort, he's come up mostly empty because:
- He doesn't have access to ML tools sophisticated enough to find multi-dimensional patterns
- He doesn't have time to learn data science on top of everything else
- The patterns he can find manually are the "obvious" ones that everyone already knows
This is the tragic irony of modern analytics: We have more data than ever, more powerful tools than ever, and yet the people closest to the business problems are further from being able to solve them than they were a decade ago.
Rethinking What a Business Intelligence Platform Should Be
This conversation made me realize we need to fundamentally rethink what is a business intelligence platform in 2025.
For the last two decades, the answer has been straightforward: A business intelligence platform is software that connects to your data, lets you build dashboards and reports, and helps you monitor KPIs. Whether you're talking about Tableau, Power BI, Looker, or any of the dozens of alternatives, they're all fundamentally built around the same core assumption: Analytics means building visualizations of known metrics.
But that's not what this analytics engineer needed. He didn't need another way to build dashboards—he needed:
- Automatic data reconciliation across disparate systems
- ML-powered pattern discovery in noisy data
- Natural language investigation capabilities
- One-click transformation from analysis to presentation
- Time back to actually think strategically
In other words, he needed an analytics and business intelligence platform that was built for discovery and investigation, not just monitoring and reporting.
What This Really Means
This isn't just one person's struggle. In hundreds of conversations over the past year, I keep hearing variations of the same story:
The promise: "We'll democratize data! Everyone will be data-driven!"
The reality: A tiny number of technical specialists are completely overwhelmed, while business users either wait in queue or give up and export to Excel.
The modern data stack was supposed to solve this. ETL tools, cloud warehouses, modern BI platforms—all designed to make analytics faster and more accessible.
But here's what actually happened: We automated the easy parts (data movement, storage, visualization) while leaving the hard parts (discovery, insight generation, strategic analysis) to manual human effort. We made it easier to build dashboards while making it harder to answer novel questions.
The result? Analytics professionals spend 70% of their time on repetitive requests—building similar analyses with slight variations, creating the same reports with different filters, updating presentations with fresh numbers.
Meanwhile, the strategic work—the "what does this actually mean for our business?" work—gets pushed to evenings and weekends, or simply doesn't happen at all.
The Moment of Recognition
What fascinated me about this particular conversation was watching this professional's reaction as we demonstrated capabilities he hadn't imagined were possible from a business intelligence platform.
When we showed how you could use familiar spreadsheet formulas (VLOOKUP, SUMIF) to transform millions of rows of data without writing SQL or Python—his energy completely shifted. This wasn't a "nice feature"—this was potentially getting hours of his week back.
When we demonstrated running machine learning models on customer churn data with zero code, and getting results explained in plain English rather than statistical jargon—you could practically see the wheels turning. Maybe there actually are patterns in that noisy nonprofit data that I just couldn't see manually.
When we showed auto-generating PowerPoint presentations from analyses—complete with corporate branding—he immediately understood: "Yeah, that would actually be super helpful."
These weren't reactions to cool technology. These were reactions to someone finally understanding the actual job and building tools for it.
The Bigger Picture
This conversation crystallized something I've been thinking about for months: We're in the midst of a massive shift in how analytics actually works.
Traditional business intelligence platforms were optimized for building production dashboards and reports. The assumption was: Define your KPIs, build your dashboards, monitor them regularly. That's "being data-driven."
But that's not how business questions actually work. Real questions are messy:
- "Why did our Enterprise segment shrink last month?"
- "What customer behaviors predict expansion opportunities?"
- "Which features should we prioritize to improve retention?"
These aren't dashboard questions. They're investigation questions. They require:
- Combining data from multiple systems
- Testing multiple hypotheses
- Running sophisticated analyses
- Synthesizing findings into recommendations
- Presenting results to executives
And traditionally, each of these questions has meant: Submit a request to the analytics team, wait days or weeks, iterate through multiple rounds of clarification, and hope the final result actually answers what you needed to know.
No wonder business users give up and stick with Excel.
What Comes Next
The professional I spoke with this week is going to go through his company's IT evaluation process to start testing our platform. Maybe it'll work out, maybe it won't. That's not really the point.
The point is: He represents millions of analytics professionals who are stuck in an impossible situation—expected to be strategic while drowning in tactical work.
The tools exist to fix this. AI that can orchestrate complex analyses. ML algorithms that can find patterns humans miss. Interfaces that speak business language rather than requiring SQL fluency.
But the shift requires rethinking some fundamental assumptions about what an analytics and business intelligence platform should deliver:
- Analytics isn't about dashboards anymore—it's about investigation and discovery
- Business users can handle sophisticated analysis—if the interface is right
- AI should orchestrate, not replace—using AI to coordinate real algorithms, not generate text
- Speed matters more than perfection—better to get 80% answers in minutes than 100% answers in weeks
- Strategic capacity is the scarcest resource—tools should multiply it, not consume it
The companies that figure this out first—that give their business users the ability to answer their own questions with sophisticated tools—are going to have an enormous competitive advantage.
Everyone else will keep waiting in the queue.
A Question for You
If you're reading this and nodding along because you recognize yourself in this story, I'm curious: What percentage of your time goes to work that could be automated versus work that actually requires human judgment?
And more importantly: What would you do with your time if you got 10 hours a week back?
I'd love to hear from you. Drop me a note or connect with me on LinkedIn. These conversations shape how we're thinking about the future of analytics.
FAQ
What is a business intelligence platform?
A business intelligence platform is a software system that collects, processes, and visualizes data to help organizations make informed decisions. Traditional business intelligence platforms typically include tools for:
- Connecting to various data sources (databases, applications, files)
- Transforming and preparing data for analysis
- Creating dashboards and reports
- Sharing insights across the organization
Examples of established business intelligence platforms include Tableau, Power BI, Looker, and Qlik. These tools have been the industry standard for operational reporting and monitoring key performance indicators (KPIs).
However, as the blog post above illustrates, traditional business intelligence platforms were designed primarily for IT teams and data analysts to build production dashboards—not for business users to conduct ad-hoc investigations or run sophisticated analyses independently.
How is an analytics and business intelligence platform different from traditional BI?
An analytics and business intelligence platform goes beyond basic reporting to include advanced analytical capabilities like:
- Predictive analytics: Using machine learning to forecast outcomes (like customer churn or deal closure probability)
- Pattern discovery: Automatically finding segments and relationships in data that aren't visible through manual analysis
- Root cause analysis: Investigating why metrics changed, not just showing that they changed
- Natural language interaction: Asking questions in plain English rather than building queries or dashboards
The distinction matters because traditional BI platforms answer the question "What happened?" while an analytics and business intelligence platform helps answer "Why did it happen?" and "What should we do about it?"
This is the gap the analytics engineer in our story was experiencing: He had access to a modern BI stack for building dashboards, but no accessible way to conduct the sophisticated investigations his role required.
Why do companies still struggle with analytics despite having a business intelligence platform?
This is one of the most common questions we hear, and the blog post touches on it directly. Companies invest heavily in business intelligence platforms, cloud data warehouses, and ETL tools—doing everything "right" from an architectural perspective—yet still face these challenges:
- The Technical Bottleneck: Traditional business intelligence platforms require technical skills (SQL, data modeling) that most business users don't have. This creates a queue where analytics teams are overwhelmed with requests.
- The Discovery Gap: BI platforms excel at monitoring known metrics, but struggle with exploratory questions like "What hidden customer segments exist in our data?" or "What factors predict expansion opportunities?"
- The Integration Tax: As illustrated in the blog post, even with great infrastructure, professionals spend enormous time on data mapping, reconciliation, and preparation rather than actual analysis.
- The Manual ML Barrier: Running machine learning models traditionally requires Python or R skills, putting sophisticated pattern discovery out of reach for business users.
The result? Analytics professionals spend 70% of their time on repetitive tactical work instead of strategic analysis, while business users either wait in queue or resort to Excel.
What should I look for in a modern business intelligence platform?
Based on the pain points revealed in conversations like the one described in this blog post, a modern business intelligence platform should provide:
For Business Operation Leaders:
- Natural language interface: Ask questions conversationally without learning query languages
- Automated insight discovery: ML-powered pattern detection that finds what you couldn't see manually
- Self-service investigation: Ability to answer follow-up questions without submitting new requests
- Explainable results: Understanding why predictions are made, not just seeing black-box scores
For Analytics Teams:
- Workflow automation: Eliminate repetitive tasks like building similar reports with slight variations
- Governed self-service: Empower business users while maintaining data security and quality
- No-code ML deployment: Enable predictive analytics without requiring data science expertise
- Integration with existing tools: Complement rather than replace your current BI stack
For the Organization:
- Fast time-to-value: Minutes to insights, not weeks to dashboard development
- Scalability: Handle growing data volumes and user bases without proportional cost increases
- Auditability: Complete lineage tracking and explainable results for compliance


