

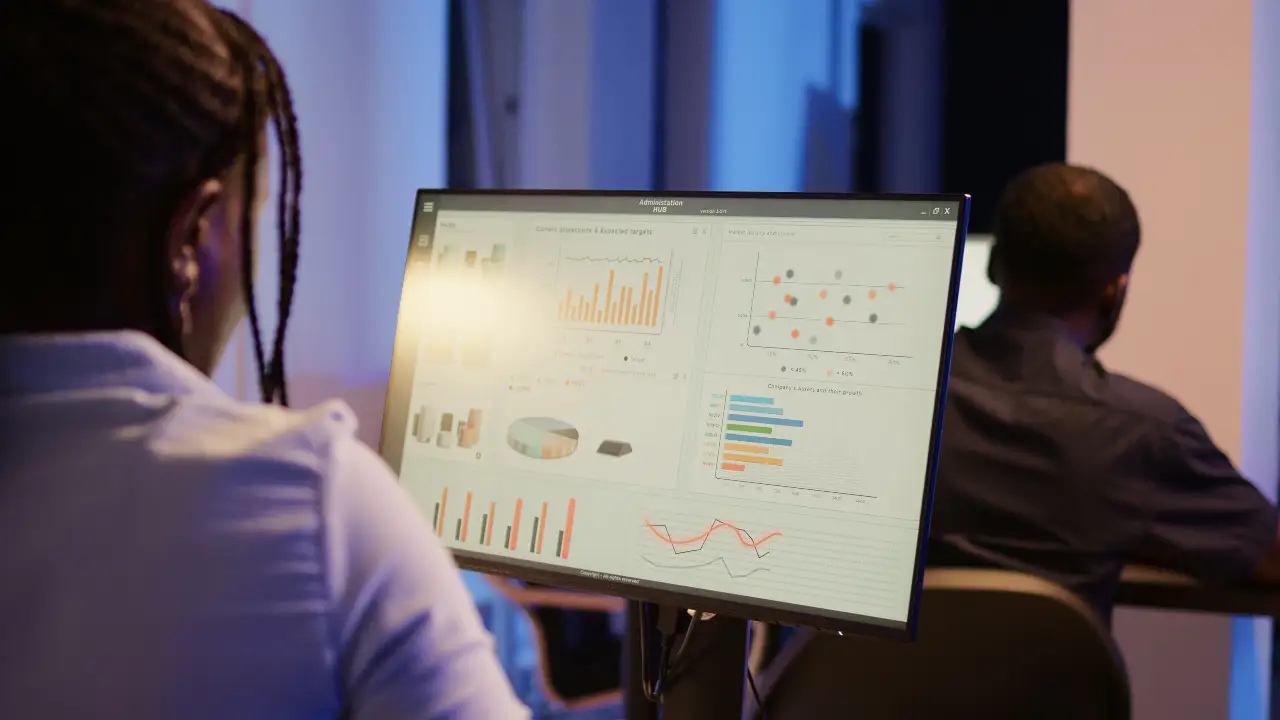
Agentic Analytics: 2026 Guide
Agentic analytics is an approach to data analysis in which autonomous AI agents handle the full analytical workflow:
- Ingesting data
- Building the analytical model
- Running queries
- Interpreting results
- Synthesizing findings into reports
Unlike chatbots or copilots that answer one question at a time, agentic analytics systems plan and execute multi-step investigations without a human driving each click.
This is not the same as having an AI summarize numbers. The difference is operational.
An agentic system understands how analytics actually works:
- Query structure
- Data models
- Aggregation logic
- Visual rules
Agentic analytic use these and executes each step against real BI infrastructure, not by guessing.
In 2026, Tableau, Databricks, ThoughtSpot, and Salesforce all use the term in their product narratives.
The category is no longer disputed.
What is disputed is what good agentic analytics looks like, and what separates a useful agent from one that confidently returns the wrong number.
This is also where the broader agentic AI conversation intersects with how analytics actually gets done.
What agentic analytics actually does
An agentic analytics system performs five operations end to end, in sequence, without a human intervening between steps.
Semantic understanding of data
The system ingests a dataset and builds a model of what it represents.
- Fields
- Relationships
- Hierarchies
- Dimension-versus-measure distinctions
- Time-series patterns
This happens before any analysis runs.
Automated data preparation
Raw data gets shaped into a usable analytical model.
- Timestamps become morning, afternoon, and evening buckets.
- Zip codes get rolled into regions.
- Derived fields get calculated.
Work that an analyst would normally do by hand, now handled automatically.
The five core components of an agentic analytics stack hinge on getting this layer right.
Deterministic execution
The agent drives a real BI engine. Filters get applied. Aggregations get built. Metrics get selected. Visualizations get generated. The output is a structured analytical artifact (dataset, calculation, chart) that updates when the underlying data changes. It is not a narrated text answer.
Narrative assembly
Outputs get organized into coherent stories. The agent decides what to highlight, what to group, and what to present in what order. The reader gets a brief, not a chart dump.
Integrated advanced analysis
Statistical methods and machine learning models run alongside the BI workflow. The agent surfaces patterns a manual analyst would miss, then explains them in business terms. For a deeper look at how the workflow runs end to end, Scoop's blog walks through a working example.
A typical agentic analytics run can involve hundreds of agent instructions, each directing a discrete action by the BI engine. The structured output is built up step by step, not generated as a single prose response.
Agentic Analytics vs Natural Language Analytics
This is also why agentic systems and natural language analytics are not the same thing.
- Natural language is the interface.
- Agentic execution is the operation behind it.
You can have one without the other.
Most copilots have natural language but stop short of running the full stack.
Agentic Analytics vs Agentic BI vs Augmented Analytics
The three terms overlap, but they describe different scopes.
Agentic analytics is the broadest. Agentic BI is narrower.
Augmented analytics is the category these grew out of.
Augmented analytics has been the dominant category framing for the past few years.
It assumes a human at the center of the workflow with AI accelerating each step.
Agentic BI is narrower.
It refers specifically to AI agents that automate dashboards, scheduled reports, and chart creation.
The agent acts as a BI operator, not a full analyst.
Agentic analytics is the wider concept.
The agent does not just run BI. It connects data prep, BI, and statistical analysis under one system, and produces a finished investigation rather than a dashboard view.
The specific differences between agentic and augmented analytics are worth understanding before evaluating tools.
Agentic BI runs your dashboards. Agentic analytics runs the full stack: data prep, BI, machine learning, and interpretation. The human reads the answer, not the chart.
Industry observers describe the lineage cleanly: manual SQL gave way to augmented analytics, which is now giving way to agentic analytics.
Each step shifts more of the analytical workload from human to machine.

Why most agentic analytics tools fall short
Most current implementations get the plumbing right and the reasoning wrong.
That is where they fail.
The technical infrastructure problem is largely solved.
The Model Context Protocol gives AI agents a standard way to read business data.
Most BI vendors now ship an MCP server.
Reaching the data is no longer the bottleneck. What the agent does next is.
The common failure modes for agentic analytics tools:
Confidently wrong numbers
Agents that generate answers from large language models without operating real BI infrastructure can hallucinate metrics.
The number reads plausibly. But the math is wrong.
No business context
The agent understands the data structurally but not contextually.
It does not know:
- Which patterns matter in this business
- Which thresholds signal trouble
- Which combinations of indicators predict a problem.
One question at a time
Many BI tools are labeled as agentic and are really conversational copilots.
They answer the question asked.
They do not run multi-step investigations or surface what the user did not think to ask.
No semantic layer
Without a governed semantic layer, the same metric gets computed three different ways across three queries.
The agent looks fluent.
The results are inconsistent.
Reaching the data is not enough
Reaching the data is no longer the moat. The moat is whether the agent understands what the data means in this business, and whether the math it produces can be trusted.
Gartner's 2026 prediction sharpens the point: 60% of agentic analytics projects relying solely on MCP will fail due to lack of a consistent semantic layer.
This is also why categories like Tableau Pulse and Power BI Copilot sit in a different layer from a full agentic analytics platform.
They are good at surfacing summaries against known metrics.
They are not designed to run investigations that explain why a metric moved.
The new bottleneck is context, not capability
Every analytics vendor will have agentic capabilities by the end of 2026. The differentiator is whose agents understand the business.
This is the gap most agentic analytics tools have left open.
The data is there.
The agents can reach it.
The interpretation layer:
- What this number means in this context
- What to do about this number found
This interpretation still lives in the heads of a few experienced operators.
Brad Peters has described the missing piece this way:
If we took a tape recorder and recorded everything you thought as you looked at your BI reports, can we stick that into the system so it can do that on your behalf?
That captures what a generic agentic analytics stack lacks.
The agent has the data.
It does not have the interpretation logic that an experienced operator brings to the same dashboard.
This gap shows up in three predictable ways:
The drift problem
Best practices get set.
Then things unravel.
Standards slide.
No agent that lacks domain context will notice it happening.
The interpretation gap
A dashboard shows what happened.
It does not tell you:
- What it means in the business
- Which combinations of signals matter
- What to do next
The reading-comprehension problem
People receive reports they cannot fully interpret but cannot ask about after years of being on the distribution list.
Without an interpretation layer, the report remains scenery.
Scoop's Domain Intelligence
We built Scoop specifically to close this gap.
Scoop's team sits with the operators who actually run the business:
- COOs
- Regional VPs
- Asset managers
- Long-tenured ops leaders
And then captures how they read their existing BI.
That captured logic gets encoded into the system.
The agent then runs that logic across:
- Every location
- Every cycle
- Fully automated
It sits on top of the customer's existing data warehouse, BI tool, and operational systems.
It does not replace anything.
There is no migration and no data copy.
The customer's data stays in the customer's environment, governed under existing controls.
Everyone has AI. Nobody has context. The next phase of agentic analytics is whose agents understand your business, not whose agents can reach your data.
What agentic analytics looks like in practice
The clearest example is a multi-step investigation that runs without a human at the controls.
A working agentic analytics system does not just answer a question.
It runs a sequence:
- Screen the data
- Decide what looks unusual
- Investigate the flagged items
- Find root causes
- Write the report
All without a human between steps.
A canonical run looks like this:
Screen
Multiple analytical lenses run in parallel across every location, account, or unit.
Flag the ones that look unusual.
Flag and prioritize
Different items flag for different reasons.
The system queues them by severity.
Spawn probes
Each flagged item gets investigated with a set of diagnostic queries.
The agent decides what to investigate next based on what the data shows, not a fixed script.
Run machine-learning decision trees
The system tests every dimensional combination to find which factors best explain a year-over-year change.
It surfaces what nobody thought to check.
Synthesize
The agent writes a per-item narrative with action items.
Roll up
Results aggregate to:
- District
- Region
- Division
- Portfolio levels
Each role gets a brief sized for it.
The step-by-step investigation engine handles each layer.
What this looks like in production:
A multi-location operator with 39 sites across 4 districts ran a full automated investigation. Out of 39 locations, only 2 had no concerns.
The system found a self-reinforcing decline in one location (down 18%, then 22%, then 34% across three quarters), diagnosed the cause as restrictive pricing leading to customer attrition, and discovered through machine learning that customer loyalty tier was the single strongest predictor of variance across the portfolio.
An analyst working manually would not have tested that dimension.
The system tested every one.
Out of 39 locations investigated automatically, only 2 had no concerns. The other 37 had findings ranked, root causes traced, and recommended actions written. No analyst sat at the keyboard.
That is the difference between answering a question and running an investigation beyond the dashboard.
And it is why multi-location retail and operations teams are the highest-leverage early users for this kind of system.
The value compounds with every location the agent covers.
How to evaluate an agentic analytics platform
Six questions separate a real agentic analytics platform from a chatbot with a good marketing page.
The 6-questions you should ask:
1. Does the agent operate real BI infrastructure, or does it narrate over a warehouse?
Agents that generate text answers from raw queries are prone to hallucination.
Agents that drive a deterministic BI engine produce auditable artifacts.
2. Does the system run multi-step investigations, or does it answer one question at a time?
A copilot answers what you ask.
An agent answers what you did not think to ask.
3. Is there a governed semantic layer?
Without one, the same metric will get computed inconsistently across runs.
4. Does the agent encode business context, or just data structure?
Generic agents understand fields and relationships.
They do not know what matters in this business.
5. Does it sit on top of existing systems, or require migration?
Real agentic analytics layers onto your stack.
Anything asking you to rip and replace is a different conversation.
See how a side-by-side comparison against Tableau plays out on this axis.
6. Can you audit how the agent reached the conclusion?
Traceable evidence beats confident text every time.
A real agentic analytics platform shows its work
You can see the filters, the formulas, the rules. You do not have to trust the answer. You can verify it.
For teams just starting out, Scoop Self-Serve is the lower-friction entry point:
- Connect data
- Ask questions
- Get answers in minutes
- No SQL
For operations leaders who want every location investigated every cycle, that workflow scales up to a full agentic analytics stack from prep to ML.

Frequently Asked Questions about Agentic Analytics
What is agentic analytics?
Agentic analytics is a category of data analysis in which autonomous AI agents handle the full analytical workflow: ingestion, preparation, querying, interpretation, and reporting. The system runs multi-step investigations without a human driving each step. For background on the underlying AI pattern, see what agentic AI actually is.
What is the meaning of agentic analytics?
The word "agentic" refers to agency: the capacity to act independently toward a goal. In agentic analytics, that means the AI does not wait for a prompt. It plans the analytical work, executes it, adapts based on what the data shows, and iterates until it reaches a conclusion. The "analytics" half grounds that autonomy in real data operations: ingestion, preparation, querying, statistical analysis, and reporting. Put together, agentic analytics means a system that decides what to investigate and how, rather than one that simply answers the question you typed.
What is the difference between agentic analytics and agentic BI?
Agentic BI refers specifically to AI agents that automate BI workflows such as dashboards, queries, and reports. Agentic analytics is broader: it covers the full stack from data prep through interpretation, including statistical analysis and narrative output. More on why agentic BI is becoming the new standard.
How is agentic analytics different from a chatbot or AI copilot?
A chatbot or copilot answers questions one at a time when prompted. An agentic analytics system plans and executes a sequence of analytical steps, finds patterns the user did not ask about, and produces a finished report rather than a conversation transcript.
Do I need to replace Tableau or Power BI to use agentic analytics?
No. The strongest agentic analytics platforms sit on top of existing BI tools, data warehouses, and operational systems. They add an interpretation and investigation layer, not a replacement for what is already in place. A direct comparison against Power BI lays out the layering model.
Can agentic analytics hallucinate numbers?
It depends on the architecture. Systems that generate answers directly from a language model without operating real BI infrastructure can produce confidently wrong numbers. Systems that drive a deterministic analytics engine and surface their work do not. Accuracy varies significantly across AI tools, and the architecture, not the model, is the deciding factor.
Who is agentic analytics for?
Operations leaders, data and analytics directors, BI teams, and executives who need answers from data faster than a manual analyst can produce them. Multi-location operators benefit most because the value compounds across every location the agent investigates. For evaluation steps, see how to get started with agentic analytics.
Is agentic analytics secure?
It depends on how the system is built. The same autonomy that makes agents useful also widens the threat surface, because agents operate with privileged access to business data and can act without a human reviewing each step. Common risks include prompt injection, inconsistent access controls across queries, and agents that produce confidently wrong outputs.
What is the difference between agentic analytics and augmented analytics?
Augmented analytics keeps a human at the center of the workflow, with AI accelerating each step by suggesting insights, automating prep, and surfacing patterns. The analyst still drives. Agentic analytics moves the human to the end of the workflow. Autonomous agents run the full stack from data prep through interpretation, and the person reads the finished output instead of operating the tool. The lineage is clean: manual SQL gave way to augmented analytics, which is now giving way to agentic execution. Each step shifts more of the analytical workload from human to machine.
What is the ROI of agentic analytics?
The return comes from two places: time saved and coverage gained. A manual analyst can investigate a handful of locations or accounts per cycle. An agentic system investigates every one, every cycle, which is why multi-location operators see the value compound with each unit the agent covers. In one automated run across 39 sites, only 2 came back with no concerns, while the other 37 had findings ranked, root causes traced, and actions written, with no analyst at the keyboard. That is work that would take a team weeks to reproduce by hand. With CFOs scrutinizing AI spend more closely in 2026, the platforms that justify their cost are the ones that turn raw data into executive-ready briefs at a scale no manual team can match.


