
You might be wondering: "Isn't location just one small piece of the puzzle?" Here's the surprising truth. Among companies using advanced customer segmentation, 22.6% prioritize geographic data as their primary segmentation method. Why? Because location shapes everything from what people buy to how they want to buy it.
What Is Geographic Segmentation and Why Should Operations Leaders Care?
Geographic segmentation organizes your customers based on their physical location and the characteristics of where they live.
Think about it this way. A customer in Phoenix, Arizona, has fundamentally different needs than someone in Portland, Maine. The Phoenix customer is dealing with 110-degree summers. The Portland customer is bracing for snow and ice. If you're selling outdoor gear, seasonal promotions, or home services, would you send them the same message?
Of course not.
But here's where most operations leaders get it wrong. They think geographic segmentation is just about changing a few words in an email or swapping out images. It's so much more than that. We're talking about:
- Inventory allocation across distribution centers
- Pricing strategies that reflect local purchasing power
- Supply chain routing optimized for regional demand patterns
- Service delivery models adapted to population density
- Compliance requirements specific to states or countries
Geographic segmentation influences every operational decision you make. And when you get it right, the results speak for themselves.
The Geographic Factors That Define Customer Segments
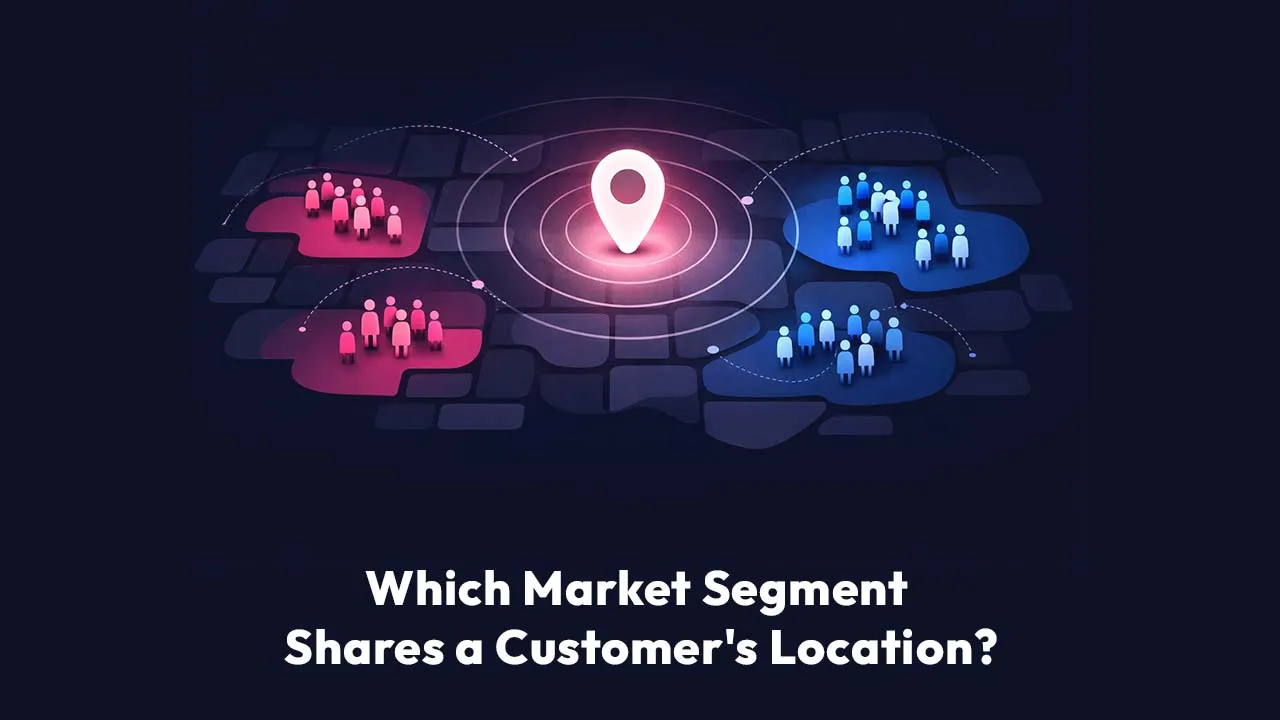
Which market segment shares a customer's location? The answer depends on how granularly you divide your geographic data. Let me walk you through the key factors that shape location-based segments.
Location Hierarchy: From Continent to Zip Code
You can segment geographically at multiple levels:
- Continental level - North America vs. Europe vs. Asia-Pacific
- National level - United States, Canada, Mexico
- Regional level - Northeast, Southeast, Midwest, West Coast
- State or province level - California, Texas, Ontario
- City level - Los Angeles, Houston, Toronto
- Neighborhood or postal code level - Beverly Hills 90210, Downtown Toronto M5H
The level you choose depends on your operational capacity and market variation. A national retailer might segment by region for inventory planning but drill down to city level for store-specific promotions.
Climate and Seasonal Patterns
Climate creates entirely different customer segments with distinct needs.
Have you ever noticed how Home Depot's front displays change dramatically based on location? In January, their Minnesota stores showcase snow blowers and ice melt. Meanwhile, their Arizona locations feature gardening supplies and outdoor living furniture. Same company. Same month. Completely different customer needs driven by climate.
This isn't just retail theater. It's operational efficiency. Shipping winter equipment to warm climates wastes warehouse space, ties up capital, and frustrates customers who see products they'll never need.
Population Density and Type
Urban, suburban, and rural customers operate differently:
- Urban customers (high density) - Value convenience, speed, and smaller package sizes
- Suburban customers (medium density) - Prioritize family-oriented products and bulk purchasing
- Rural customers (low density) - Need durability, self-service options, and are willing to buy in larger quantities due to distance from stores
Your delivery models, product sizes, and even customer service hours should reflect these differences. A 24-hour customer service line makes sense for urban markets with varied schedules. Rural customers might prefer extended email support during evening hours when they're home from work.
Cultural Preferences and Language
Geographic location often correlates with cultural norms and language preferences. This matters operationally because:
- Product descriptions need localization, not just translation
- Customer service teams require cultural competency training
- Return policies might need adjustment for different cultural expectations
- Marketing creative must avoid culturally insensitive imagery or messaging
Here's a real-world example. A global consumer goods company discovered that their "family size" product positioning worked well in the U.S. Midwest but fell flat in urban Northeast markets where smaller household sizes were the norm. Same product. Different geographic segment. The solution? They created "apartment-friendly" packaging for high-density urban areas while maintaining family sizes for suburban and rural markets.
How Geographic Segmentation Connects to Broader Customer Segmentation
Let me be clear about something important. Geographic segmentation rarely works in isolation.
The most sophisticated customer segmentation strategies layer geographic data with demographic, behavioral, and psychographic information. This is where AI customer segmentation tools become invaluable for operations leaders managing complex, multi-market businesses.
The Four Pillars of Customer Segmentation
1. Demographic Segmentation Age, income, gender, education level, family size, occupation
2. Geographic Segmentation Location, climate, population density, cultural region
3. Behavioral Segmentation Purchase frequency, product usage, brand loyalty, benefits sought
4. Psychographic Segmentation Values, lifestyle, personality traits, interests, attitudes
Think of these as layers in a blueprint. Geographic data provides the foundation—it tells you where your customers are. But adding demographic data tells you who they are. Behavioral data reveals what they do. Psychographic data explains why they do it.
Why Operations Leaders Need All Four Segments
You might be managing operations for a company selling premium coffee makers. Here's how combining segments creates actionable intelligence:
Geographic alone: "We have customers in Seattle and Miami."
Geographic + Demographic: "We have affluent, educated customers aged 35-54 in Seattle and Miami."
Geographic + Demographic + Behavioral: "We have affluent, educated customers aged 35-54 in Seattle who buy premium single-origin beans monthly, and similar customers in Miami who prefer espresso blends."
All four segments combined: "We have environmentally-conscious, affluent, educated customers aged 35-54 in Seattle who value sustainability, buy premium single-origin beans monthly, and want their purchases to support fair-trade practices. Similar Miami customers prioritize convenience and bold flavors for entertaining."
See the difference? Now you know:
- Seattle operations need partnerships with fair-trade suppliers and eco-friendly packaging
- Miami operations should stock entertaining-size products and bold flavor profiles
- Inventory planning requires different product mixes for each location
- Marketing messaging must emphasize different value propositions by region
What Are AI Customer Segmentation Tools and How Do They Enhance Geographic Segmentation?
Traditional geographic segmentation relied on manual analysis, demographic surveys, and educated guesses. Time-consuming. Labor-intensive. Often outdated by the time insights were implemented.
AI customer segmentation tools have transformed this landscape entirely.
How AI Tools Process Geographic Data
Modern AI customer segmentation tools analyze millions of data points simultaneously:
- Transaction history with timestamps and locations
- IP geolocation data showing where customers browse and buy
- Shipping addresses revealing delivery destinations
- Mobile app location data (with consent) showing movement patterns
- Weather data correlated with purchase behavior
- Local event calendars that might influence buying cycles
- Economic indicators by region (unemployment rates, income levels, housing prices)
Here's what makes AI tools powerful for operations leaders. They don't just identify which market segment shares a customer's location. They predict how location-based behaviors will change.
For example, an AI tool might detect that customers in coastal areas increase purchases of specific products 72 hours before predicted storms. That's not something you'd catch in a quarterly review. But it's precisely the kind of pattern that lets you pre-position inventory, adjust staffing, and capture revenue that competitors miss.
Real-World Impact: The Kraft Heinz Example
Let's talk about results. Kraft Heinz, one of the world's largest consumer goods companies, implemented AI-powered geographic segmentation using geolocation data to personalize homepage banners, product recommendations, and calls-to-action based on user location.
The results?
- 78% increase in conversions
- 30% increase in engagement
- 28% increase in customer satisfaction
These aren't marginal improvements. These are transformational results driven by understanding which market segment shares a customer's location and acting on that intelligence in real-time.
How Scoop Analytics Makes Geographic Segmentation Accessible
We've seen firsthand how operations leaders struggle with the gap between having customer data and actually using it for geographic segmentation. Your data sits in Salesforce, your e-commerce platform, your warehouse management system—all disconnected.
Scoop Analytics bridges this gap by connecting directly to your existing data sources and making customer segmentation instantly accessible. No coding required. No waiting for IT resources. No expensive consulting engagements.
What makes Scoop Analytics particularly valuable for geographic segmentation?
Natural Language Queries Instead of learning complex SQL or waiting for data analysts, you simply ask: "Show me customer purchase patterns by state" or "Which cities have the highest average order values?" Scoop's AI understands your question and delivers the analysis in seconds.
Automatic Segment Detection Scoop Analytics doesn't just show you data—it actively identifies geographic patterns you might miss. The system automatically detects customer clusters, highlights regional anomalies, and surfaces opportunities like underserved markets or unexpected demand spikes in specific locations.
Real-Time Dashboard Updates Your geographic segments aren't static. As customers move, purchase behaviors shift, and new markets emerge, Scoop Analytics updates your dashboards automatically. You're always working with current intelligence, not last quarter's snapshot.
Cross-Functional Accessibility Here's the game-changer for operations leaders: Scoop Analytics makes geographic insights available to everyone who needs them. Your inventory manager can check regional stock levels. Your pricing team can analyze market-specific sensitivity. Your logistics coordinator can optimize routes based on demand patterns. All without submitting IT tickets or waiting in the analytics queue.
How to Implement Geographic Segmentation: A Step-by-Step Operational Framework
You're convinced geographic segmentation matters. Now what? Here's your implementation roadmap.
Step 1: Define Your Geographic Boundaries (Week 1-2)
Start by mapping your current customer base:
- Export customer data including addresses, transaction history, and any location data you've collected
- Visualize this data on a heat map to identify concentration areas
- Determine which geographic levels matter most for your business model
- Establish 3-5 primary geographic segments to begin with
Pro tip from experience: Don't create 47 different geographic segments right away. Start with broad regions, prove the concept, then subdivide as needed.
With Scoop Analytics, this entire process simplifies dramatically. Connect your data sources, then ask: "Show me a map of customers by location with purchase volume." The visualization appears instantly, revealing your natural geographic clusters without manual data wrangling.
Step 2: Gather and Validate Location Data (Week 2-4)
You need clean, accurate data. Here's how to collect it:
First-party data sources:
- Transaction records (shipping addresses, billing addresses)
- Website analytics (IP addresses)
- Customer surveys (ask directly)
- Mobile app location services (with explicit consent)
- Customer service interaction logs
Third-party data sources:
- IP geolocation services
- Census data and government statistics
- Weather and climate databases
- Economic indicators by region
- Demographic data providers
Validation is crucial. We've seen companies make expensive mistakes because their "San Francisco" customers actually lived in San Jose but used SF addresses for prestige. Verify your data before building strategies around it.
Scoop Analytics helps with data validation by flagging inconsistencies. If shipping addresses don't match billing patterns, or if location data seems anomalous compared to purchase behavior, the system alerts you before you build strategies on faulty assumptions.
Step 3: Analyze Geographic Patterns (Week 4-6)
This is where AI customer segmentation tools prove their worth. Look for:
- Purchase volume by location - Where are your highest-value customers?
- Product preference variations - Do certain products sell better in specific regions?
- Seasonal patterns by climate - How does weather affect purchase timing?
- Price sensitivity differences - Can some markets support premium pricing?
Service requirement variations - Do some regions need more support?
This table tells a story. Midwest rural customers buy less frequently but in larger quantities (likely stocking up due to distance from stores). They also need more support per customer, suggesting either product complexity issues or preference for phone support during limited free time.
Using Scoop Analytics, generating this comparison table is as simple as asking: "Compare average order value, purchase frequency, and top products across my geographic segments." The AI builds the analysis, formats the table, and even suggests insights based on the patterns it detects.
Step 4: Design Location-Specific Operational Strategies (Week 6-10)
Now translate insights into action:
Inventory Management:
- Pre-position high-demand products in regional warehouses
- Adjust safety stock levels based on geographic demand volatility
- Time seasonal inventory transitions based on local climate patterns
Pricing Strategy:
- Test geographic pricing where competitive dynamics and purchasing power vary
- Offer region-specific promotions tied to local events or seasons
- Adjust shipping thresholds based on market willingness to pay
Supply Chain Optimization:
- Route shipments through distribution centers closest to demand clusters
- Establish regional partnerships with local suppliers for faster fulfillment
- Implement zone-based delivery pricing that reflects actual costs
Service Delivery Models:
- Staff customer service teams with regional knowledge and language capabilities
- Adjust service hours to match time zones and local work patterns
- Create location-specific FAQs addressing regional concerns
Step 5: Test, Measure, and Refine (Ongoing)
Geographic segmentation isn't "set it and forget it." Markets evolve. Populations shift. Economic conditions change.
Establish these ongoing measurement practices:
- Monthly performance reviews comparing segments against benchmarks
- Quarterly deep dives into emerging patterns or anomalies
- Annual strategy refreshes to add new segments or consolidate underperforming ones
- A/B testing of location-based strategies to validate assumptions
One critical question to ask regularly: Are our geographic segments still meaningful, or have we outgrown them?
Scoop Analytics makes continuous monitoring effortless. Set up automated reports that track your key geographic metrics weekly or monthly. If any segment shows unusual patterns—like a sudden spike in returns from a specific region or unexpected demand in a previously quiet market—you'll know immediately rather than discovering it in a quarterly review when it's too late to capitalize.
What Common Mistakes Do Operations Leaders Make with Geographic Segmentation?
Let me share some expensive lessons we've witnessed firsthand.
Mistake #1: Treating Geography as Static
Population patterns shift. The pandemic accelerated remote work, causing urban-to-suburban migration in many markets. If your 2019 geographic segments still guide your 2025 operations, you're operating on outdated intelligence.
The fix: Refresh your geographic data at least annually. Use AI customer segmentation tools to detect migration patterns in real-time.
With platforms like Scoop Analytics monitoring your data continuously, you don't need to remember to refresh manually. The system tracks changes as they happen, alerting you when customer concentrations shift enough to warrant strategic adjustments.
Mistake #2: Over-Segmenting Without Resources
Creating 30 different geographic segments sounds sophisticated. But can your operations team actually execute 30 different strategies?
Most mid-sized companies lack the resources to meaningfully differentiate operations across more than 5-7 segments.
The fix: Start with 3-4 broad segments. Prove ROI. Then subdivide strategically where the business case justifies the complexity.
Mistake #3: Ignoring Local Regulations
Different states and countries have varying regulations on:
- Data privacy (GDPR in Europe, CCPA in California)
- Product labeling and safety standards
- Employment and labor laws
- Tax collection and reporting
- Environmental requirements
We've seen companies launch perfectly planned geographic strategies only to discover their operational model violated local regulations.
The fix: Build compliance review into your geographic segmentation process from day one.
Mistake #4: Focusing Only on Where Customers Are, Not Where They Could Be
Geographic segmentation often reveals gaps—areas where you have fewer customers than demographics suggest you should.
These gaps represent opportunity. Maybe your distribution network doesn't serve that area efficiently. Perhaps your marketing hasn't reached that segment. Or possibly a competitor dominates that market and you need a differentiated entry strategy.
The fix: Use geographic segmentation for both optimization (serving existing segments better) and expansion (identifying new geographic opportunities).
Scoop Analytics excels at opportunity identification. By asking "Which cities with populations over 100,000 have zero customers?" or "Show me markets similar to our top-performing region where we have low penetration," you can quickly identify expansion opportunities that manual analysis would miss.
Mistake #5: Making Data Analysis a Bottleneck
Here's the mistake that costs the most time and money: requiring every geographic analysis to go through a central data team.
Your inventory manager needs to check regional stock levels. That shouldn't require a three-day turnaround from analytics. Your customer service director wants to see support ticket patterns by location. That's not worth a formal data request.
The fix: Democratize access to geographic data across your operations team.
This is where Scoop Analytics fundamentally changes how operations teams work with customer segmentation. Because anyone can ask questions in plain English and get instant answers, geographic insights inform decisions in real-time rather than being relegated to quarterly planning sessions.
Your warehouse manager notices unusual demand from Denver and can immediately investigate whether it's a trend worth adjusting inventory allocation. Your pricing analyst can test regional price sensitivity without waiting for IT to build a custom report. Your logistics coordinator can optimize routes based on current demand patterns, not last month's data.
How Do You Choose the Right AI Customer Segmentation Tools for Geographic Analysis?
The market is flooded with customer segmentation platforms. How do you evaluate them as an operations leader?
Essential Capabilities for Geographic Segmentation
1. Multi-Source Data Integration
Your tool needs to pull geographic data from:
- Your CRM system
- E-commerce platform
- Point-of-sale systems
- Mobile apps
- Customer service platforms
- Marketing automation tools
2. Real-Time Processing
Batch processing that updates segments weekly is obsolete. Look for tools that:
- Update segments in real-time as new data arrives
- Trigger operational workflows automatically
- Alert you to significant geographic shifts as they happen
3. Predictive Analytics
The best AI customer segmentation tools don't just describe current segments. They predict:
- Which geographic markets will grow or contract
- How seasonal patterns will shift based on weather predictions
- Where new customer concentration areas will emerge
- What products will gain traction in specific locations
4. Visualization and Mapping
Operations leaders are visual thinkers. Your tool should offer:
- Interactive heat maps showing customer density
- Cluster analysis revealing natural geographic groupings
- Side-by-side segment comparisons
- Drill-down capabilities from national to neighborhood level
5. Integration with Operational Systems
Insights without action are worthless. Ensure your segmentation tool connects to:
- Inventory management systems
- Warehouse management systems
- Transportation management systems
- Marketing automation platforms
- Business intelligence dashboards
6. Accessibility for Non-Technical Users
This is the dealbreaker most operations leaders overlook. If only your data team can use the tool, you haven't solved the problem—you've just shifted the bottleneck.
The right AI customer segmentation tool should be accessible to:
- Inventory managers checking regional demand
- Pricing analysts testing market sensitivity
- Customer service directors analyzing support patterns
- Logistics coordinators optimizing delivery routes
- Marketing managers tailoring campaigns
Scoop Analytics was built specifically to solve this accessibility challenge. By allowing natural language questions like "Which states have declining sales this quarter?" or "Show me the correlation between weather patterns and product demand," the platform puts powerful geographic analysis in the hands of the people who need it most—your operational decision-makers.
Questions to Ask Vendors
- "How do you handle data privacy regulations across different geographic jurisdictions?"
- "Can your system automatically adjust segments as customers move or change behavior?"
- "What's your typical implementation timeline from contract to actionable insights?"
- "How do you validate the accuracy of geographic data, especially for IP-based locations?"
- "Can we test location-based strategies within your platform before full deployment?"
- "Can non-technical team members use this tool independently, or do they need data team support?"
- "How does your platform handle data from multiple sources with different location formats?"
What Results Should You Expect from Geographic Segmentation?
Let's talk numbers. What kind of ROI justifies the investment in geographic customer segmentation?
Benchmark Metrics from Industry Leaders
Based on documented case studies and industry research:
Conversion Rate Improvements:
- 15-30% increase in conversion rates with basic geographic personalization
- 50-80% increase with AI-powered, multi-factor segmentation (like Kraft Heinz achieved)
Operational Efficiency Gains:
- 10-20% reduction in shipping costs through optimized regional distribution
- 15-25% improvement in inventory turnover by matching stock to local demand
- 20-35% decrease in stockouts for location-appropriate products
Customer Satisfaction Enhancements:
- 25-30% improvement in satisfaction scores with location-relevant service
- 40-50% reduction in return rates when products match regional needs
- 15-20% increase in repeat purchase rates with location-based personalization
Revenue Growth:
- 12-18% revenue increase from entering previously underserved geographic markets
- 8-15% average order value increase through location-appropriate product recommendations
- 20-30% improvement in regional marketing ROI
Timeline Expectations
Month 1-2: Data collection and initial segmentation setup Month 3-4: First A/B tests of location-based strategies Month 5-6: Initial measurable improvements in targeted segments Month 7-12: Full rollout and optimization across all segments Year 2+: Advanced predictive models and expansion into new markets
With accessible AI customer segmentation tools like Scoop Analytics, these timelines can accelerate significantly. We've seen companies achieve first measurable improvements in month 2-3 rather than month 5-6 because they can iterate faster when insights are instantly available.
FAQ
Q: How is geographic segmentation different from demographic segmentation?
Geographic segmentation divides markets based on location and place-related characteristics (country, climate, population density). Demographic segmentation divides markets based on personal characteristics (age, income, education, gender). They're complementary—most effective strategies combine both.
Q: Can small businesses benefit from geographic segmentation?
Absolutely. Even local businesses can segment by neighborhood, using census data to understand micro-markets within their service area. A restaurant might target lunch promotions to nearby office buildings and dinner specials to residential neighborhoods.
Q: How often should we update our geographic segments?
Review quarterly, update annually at minimum. However, AI customer segmentation tools can monitor continuously and alert you to significant shifts requiring immediate attention, such as unexpected demand surges in new locations.
Q: What's the minimum customer base needed for effective geographic segmentation?
You can start with as few as 500-1,000 customers if they're spread across distinct geographic areas. The key is having enough customers in each segment to detect meaningful patterns and justify differentiated strategies.
Q: Should we use the same geographic segments for B2B and B2C operations?
Not necessarily. B2B often requires firmographic segmentation (company size, industry) layered with geography. B2C relies more heavily on pure geographic and demographic factors. The principles remain the same, but the execution differs.
Q: How do we handle customers who move between geographic segments?
Modern AI customer segmentation tools track this automatically through shipping address changes. Set up workflows to transition customers to their new segment's strategies within one billing cycle to maintain personalization relevance.
Q: Do we need a data scientist to implement geographic segmentation?
Not anymore. While sophisticated analysis benefits from data expertise, modern platforms like Scoop Analytics make geographic segmentation accessible to operations professionals without technical backgrounds. The key is choosing tools that match your team's capabilities.
Q: How do I know which market segment shares a customer's location in my data?
Your customer database typically includes address fields (shipping, billing, or both). These define the geographic segment. AI tools can automatically group customers by ZIP code, city, state, or custom geographic boundaries you define. The segment that shares a customer's location is simply the geographic grouping they fall into based on their address data.
Q: What if our customers shop online from different locations than where they live?
This is increasingly common with mobile shopping and remote work. The best practice is to use shipping addresses as the primary location identifier since that's where the product needs to arrive and where the customer will use it. IP addresses can supplement this for browsing behavior analysis, but shipping location typically drives operational decisions.
Taking Action: Your First Steps Tomorrow Morning
You've invested time understanding which market segment shares a customer's location and why it matters. Here's what to do next.
Tomorrow:
- Export your customer database with location fields
- Create a simple heat map using free tools like Google My Maps or ask Scoop Analytics to visualize your customer locations
- Identify your top 3 customer concentration areas
This Week:
- Compare product sales across your identified geographic clusters
- Document 2-3 obvious differences in preferences or behavior
- Calculate what a 10% improvement in your largest segment would mean for revenue
This Month:
- Run a pilot test with location-specific messaging or inventory allocation in one market
- Measure results against a control market
- Evaluate AI customer segmentation tools if manual analysis proves too time-consuming (start with Scoop Analytics for a no-code solution that your entire team can use)
This Quarter:
- Develop your full geographic segmentation strategy
- Train your operations team on location-based decision-making
- Integrate geographic data into your quarterly planning process
- Establish dashboards that automatically track geographic segment performance
The Competitive Advantage of Accessible Geographic Insights
Here's what separates winning operations teams from those struggling to keep up: access to insights.
It's not about having more data. Every company has customer location data sitting in their systems. It's about who can use that data and how quickly they can act on it.
When only your analytics team can answer geographic questions, you create a bottleneck. Simple questions like "Which regions showed the strongest sales growth last month?" or "Where should we pre-position inventory for the upcoming season?" shouldn't require three days and a formal data request.
With AI customer segmentation tools like Scoop Analytics, these questions get answered in seconds by the people who need the answers—your inventory managers, pricing analysts, customer service directors, and logistics coordinators.
That's the difference between geographic segmentation as a quarterly planning exercise and geographic segmentation as a competitive weapon.
When your warehouse manager in real-time notices unusual demand from Portland and can immediately investigate whether it's weather-driven, a local event, or an emerging trend worth adjusting inventory for—that's when customer segmentation transforms from theory to tangible business value.
When your pricing team can test regional price sensitivity on Tuesday and adjust for the weekend promotion by Thursday—rather than waiting for the next quarterly pricing review—you capture revenue that would otherwise slip away.
When your customer service director sees support tickets clustering in specific regions and can instantly analyze whether it's a shipping issue, product fit problem, or local communication challenge—and then fixes it before it becomes a retention problem—that's operational excellence powered by accessible data.
Geographic Segmentation as an Ongoing Operational Capability
The final point I want to emphasize: geographic segmentation isn't a project. It's a capability.
Too many operations leaders approach it as a one-time initiative. They do the analysis, create the segments, implement some changes, and move on to the next priority.
Then six months later, they wonder why the results have plateaued or declined.
Markets shift. Customers move. Competition intensifies. Economic conditions change. Your geographic segments from January might be irrelevant by July.
Building geographic segmentation as an ongoing capability means:
Continuous monitoring of how customer concentrations shift Regular testing of location-based strategies Systematic review of segment performance metrics Rapid iteration when patterns change Cross-functional collaboration where everyone has access to geographic insights
This requires tools that make ongoing analysis sustainable. You can't sustain continuous geographic segmentation if every question requires manual SQL queries or formal analytics requests.
But with the right AI customer segmentation tools in place—particularly those designed for accessibility like Scoop Analytics—geographic segmentation becomes part of how your operations team thinks and makes decisions every day.
Your inventory manager checks regional demand before placing orders. Your pricing analyst reviews geographic sensitivity before launching promotions. Your logistics coordinator optimizes routes based on current concentration patterns. Your customer service director monitors regional satisfaction scores weekly.
These become habits, not projects. And habits compound into competitive advantages.
Your Geographic Segmentation Journey Starts Now
Geographic segmentation isn't complicated. It's systematic.
You now understand which market segment shares a customer's location: the geographic segment defined by where they live, work, or shop. You know why location matters for operations, inventory, pricing, and customer experience. You've learned the framework for implementing it and the tools that make it accessible.
The question isn't whether geographic segmentation will improve your operations. The data proves it will.
The question is: how quickly will you implement it?
Your competitors are already using AI customer segmentation tools to understand where their customers are and what those locations mean for their businesses. They're optimizing inventory by region. They're tailoring pricing by market. They're personalizing experiences by location.
The gap between your operational performance and theirs widens every day you wait.
Start tomorrow with the simple steps outlined above. Export your data. Map your customers. Identify your clusters. Find the patterns.
Then take the next step: make geographic insights accessible to everyone who needs them. Connect your data sources to tools like Scoop Analytics that put customer segmentation in plain English. Enable your team to ask questions and get answers without gatekeepers or delays.
Geographic segmentation transforms from a strategic concept to operational reality the moment your team can independently access the insights they need to make better decisions.
That transformation can start today.
Which market segment shares a customer's location? You now know the answer. More importantly, you know exactly what to do with it.
The only question left is: will you?
Conclusion
Geographic segmentation—the market segment that shares a customer's location—is the most underutilized operational lever available to business leaders today.
Here's the truth that most operations leaders miss: you already have the data. Customer addresses sit in your CRM. Shipping destinations fill your order history. Transaction locations populate your databases. The question isn't whether you have geographic information. The question is whether you're using it strategically.
Companies that excel at geographic customer segmentation consistently outperform their competitors across every operational metric that matters:
- 15-30% higher conversion rates from location-relevant messaging
- 10-20% lower shipping costs through optimized regional distribution
- 12-18% revenue growth from entering underserved geographic markets
- 25-30% better customer satisfaction with location-appropriate service
These aren't aspirational goals. They're documented results from businesses that made geographic segmentation a core operational capability rather than a one-time analytics project.
The transformation doesn't require massive technology investments or complete organizational restructuring. It requires three fundamental shifts:
First, recognize that where your customers are located fundamentally shapes what they need, when they need it, how they want to receive it, and what they're willing to pay for it. Location isn't just another data point—it's a primary driver of customer behavior.
Second, make geographic insights accessible to the people making daily operational decisions. When your inventory manager, pricing analyst, logistics coordinator, and customer service director can independently answer location-based questions in seconds rather than days, geographic segmentation moves from strategic concept to operational reality.
Third, commit to continuous monitoring rather than periodic analysis. Markets evolve constantly. AI customer segmentation tools like Scoop Analytics that automatically track shifting patterns, detect emerging opportunities, and alert you to significant changes transform geographic segmentation from a quarterly planning exercise into a daily competitive advantage.
The companies winning in today's market understand a simple truth: generic strategies produce average results, while location-specific strategies drive exceptional performance.
Your customers in Phoenix have different needs than your customers in Portland. Your urban segments behave differently than your rural segments. Your Northeast markets respond to different messaging than your Southeast markets.
The question isn't whether geographic segmentation will improve your operations. The evidence overwhelmingly confirms it will.
The real question is: how long will you continue treating all customers the same when their locations tell you exactly how they're different?
Start tomorrow. Map your customers. Identify your patterns. Build your segments. Make the insights accessible. Watch the results compound.
Geographic segmentation isn't the future of operations. It's the present. And every day you delay implementation is another day your competitors pull further ahead.
Which market segment shares a customer's location? You now have the definitive answer—and the complete roadmap to turn that knowledge into measurable business results.
The data is waiting. The tools are ready. The competitive advantage is yours to claim.
What will you do with it?
Read More
- What Are Customer Segments in Business Model Canvas?
- How Do You Segment Customers?
- What Is Customer Segment?
- What is Customer Segments?
- How to Segment Customers: Why Your Static Buckets Are Costing You Millions


