How to Build Smarter KPI Dashboards with Scoop
Scoop Team
Yet too often, the tools meant to help us—like dashboards—fall short. They’re static and surface-level, leaving teams stranded when they need more context, deeper insights, or the flexibility to explore beyond a single snapshot. You’ve probably experienced it firsthand: staring at a dashboard that tells you what happened, but nothing about why it happened or what to do next.
It’s easy to sign up for simple KPI tools because they promise quick wins. However, you’ll quickly realize that pulling static numbers from your business tools isn’t enough. Real business data is rarely straightforward. To get a trusted KPI—the one number that matters—you often need to combine data from multiple sources, filter out internal noise, and ensure that the data reflects reality. Showing up to a meeting with caveats like, “Ignore this number because of our internal testing,” doesn’t cut it.
That’s where smarter tools like Scoop come in. Scoop delivers the simplicity of KPI dashboards but with unmatched power behind the scenes. You get prepped, aggregated, and clean data—no caveats, no exceptions—so you can trust the numbers and tell a better story. With AI-powered automation and intuitive design, Scoop makes it easy to build dynamic KPI dashboards that go far beyond the basics, helping teams not only measure performance but truly understand and act on their data.
Here’s how to build smarter KPI dashboards with Scoop, step by step.
The data is there. The why isn't.
Scoop connects to your CRM, marketing tools, and spreadsheets and investigates like a senior analyst — testing hypotheses, finding patterns, and surfacing what's actually driving your numbers.
✨ No credit card required • 🔗 150+ data source connections • 👤 No data team needed
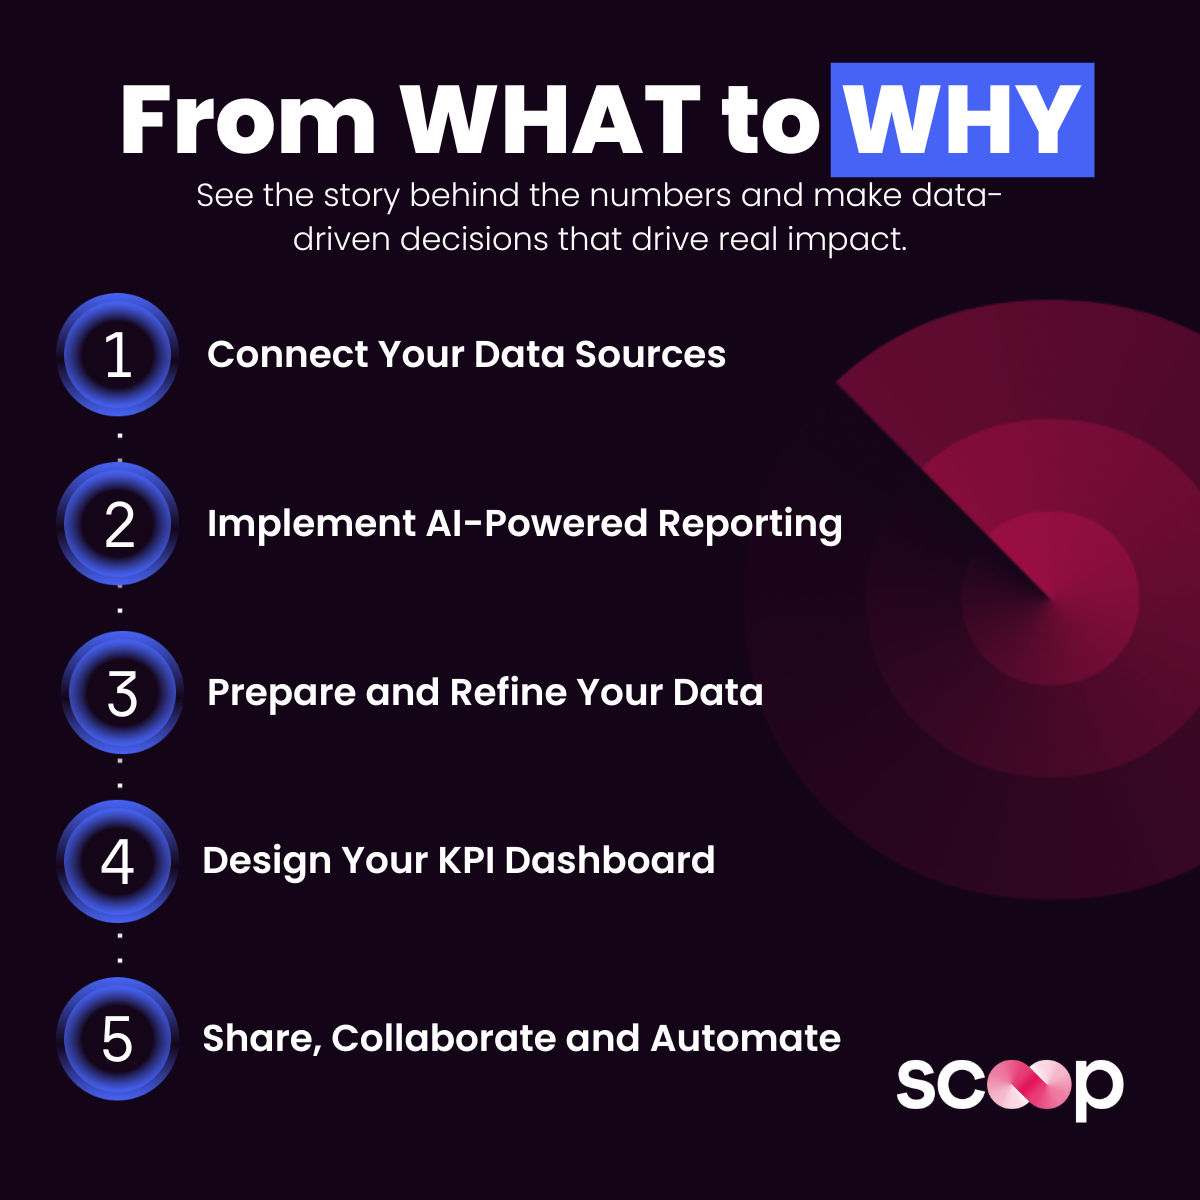
Step-by-Step Guide to Building Smarter KPI Dashboards with Scoop
**1. Connect Your Data Sources
**Scoop makes it easy to connect to your data sources, whether it’s a CRM, business tool, or spreadsheet. Use Scoop's seamless integrations to link your data directly—no complex setup required. This ensures all the data you need is centralized and ready for analysis.
Steps:
- Identify Key Data Sources: Determine which platforms hold the KPIs essential for your operations, such as CRM systems, marketing platforms, financial databases, or customer service tools.
- Establish Connections: Use Scoop's intuitive interface to connect these data sources. The platform supports a wide range of integrations, making it straightforward to bring in data from various applications.
**2. Implement AI-Powered Reporting
**Start with Scoop's generative AI reporting to let the platform do the hard work for you. Simply ask questions or input prompts, and Scoop will generate relevant visuals, charts, and insights. This approach ensures you get a solid starting point, uncovering key trends and patterns instantly.
Steps:
- Ask Questions: Use Scoop's AI reporting to ask natural-language questions about your data.
- Generate Insights: Scoop will create charts, graphs, and visual summaries that highlight the key metrics and trends.
- Save Initial KPI's: Use the AI-generated visuals as a foundation for building your final KPI dashboard.
**3. Prepare and Refine Your Data
**Once AI has generated the initial insights, refine the data to ensure quality. Scoop's preparation tools allow you to clean, blend, and filter your data so you can remove outliers and focus on what matters most.
Steps:
- Data Cleaning: Review the imported data to ensure accuracy, consistency, and completeness. Address any anomalies or missing values as needed.
- Exclude Internal Noise: Filter out test data, outliers, or irrelevant internal metrics that might otherwise skew your numbers.
- Adjust and Recalculate: Use Scoop's spreadsheet-like functions to refine KPIs, create custom calculations, and ensure data quality.
**4. Design Your KPI Dashboard
**Place your reports and KPIs on presentation-ready dashboards that are designed to impress. Import your PowerPoint decks, and Scoop will automatically create a brand color scheme. This ensures that every chart, graph, and sheetlet you place matches seamlessly with your brand, creating a professional and cohesive presentation.
Steps:
- Layout and Design: Import PowerPoint decks or start from scratch, and use Scoop's automated brand color guide to ensure everything looks clean, polished, and on-brand.
- Select KPIs: Choose the most relevant KPIs that align with your business objectives. For instance, a sales ops team might focus on metrics like lead conversion rate, average deal size, and sales cycle length.
- Choose Visualizations: Scoop offers a variety of visualization options, including a specific 'KPI' visualization for when you need to highlight one solid number. If you want to explain that number further, you have the flexibility to add supporting charts, graphs, sheetlets, and copy to provide context and tell the full story behind your data.
**5. Share and Collaborate
**Scoop facilitates seamless sharing and collaboration, ensuring that stakeholders have access to the insights they need.
Steps:
- Sync Options: Sync your presentations to PowerPoint or share interactive Scoop links with live, automatically updating data, ensuring that presentations are always up-to-date.
- Access Controls: Manage user permissions to control who can view or edit the presentations, maintaining data security and integrity.
- Feedback and Iteration: Encourage stakeholders to provide feedback and use Scoop's flexible platform to make iterative improvements to the presentation as business needs evolve.
**6. Automate Reporting and Updates
**One of Scoop's standout features is its ability to automate reporting and keep your data current without manual intervention.
Steps:
- Scheduled Refreshes: Automatically refresh data to ensure your dashboard reflects the most recent information.
- Snapshotting: Utilize Scoop's automated snapshots to track and analyze changes over time, gaining clear insights into what’s changed, when, and why.
- Real-Time Monitoring: Enable real-time data updates for KPIs that require continuous monitoring, allowing for timely decision-making.
Practical Tips for Maximizing Scoop's Potential
- Leverage Pre-Built Templates: Scoop offers instant recipes and templates tailored to various business needs, such as sales pipeline tracking or performance overviews, to accelerate dashboard creation.
- Customize Calculations with Compound KPIs: Create complex logic by combining multiple KPIs into compound formulas using spreadsheet syntax, enabling nuanced analysis across different datasets.
- Filter Out Noise: Use advanced filters to exclude irrelevant internal data and ensure your KPIs reflect true performance.
- Explore Advanced Styling Options: Customize fonts, colors, and layouts to create visually tailored reports and dashboards that align with your brand identity.
Wrapping Up: Build KPI Dashboards That Work Smarter, Not Harder
By using Scoop, you’re not just tracking KPIs—you’re unlocking the why behind the numbers, automating the analysis, and building data stories that drive smarter decisions. Whether you’re in revenue ops, marketing ops, sales ops, or customer success, Scoop empowers your team to move beyond surface-level metrics and dig into meaningful insights.
Dashboards are a starting point, but real value comes when you can interpret the data, tell a story, and have a conversation about what it all means. Scoop is designed to make this process seamless, intuitive, and powerful—giving you the tools to work smarter, uncover opportunities, and take action with confidence.
Start building smarter KPI dashboards and presentations today, and transform the way your team understands and leverages data. With Scoop, you get the ease of a simple KPI tool—but with so much more power behind the scenes. Trust us: once you start using Scoop, you’ll see just how much more you really need.
Read More:
- The Limitations of Databox: Why You Might Need More Than Just KPIs
- Databox vs. Scoop: Which KPI Management Tool Is Right for You?
- How to Build Smarter Operations?
- How PE Firms Leverage Data for Smarter Investments
- Creating Insightful Marketing Dashboards with HubSpot Data