Historical Data Analysis: Using Data to Understand the Past
Scoop Team
Every distributed business already sits on years of it. The problem is rarely access. It is interpretation. A RevOps lead can see that win rates slipped last quarter.
Knowing why, and what to do about it before it repeats, is the part that does not scale. This guide covers:
- What historical data analysis is
- The data types and methods that matter
- How point-in-time snapshots make it reliable
- How ops and revenue teams put it to work on the pipeline
The data is there. The why usually is not. That is what separates a report you read from a report you can act on. It is also where data-driven decision making either happens or stalls.

What is historical data analysis?
Historical data analysis is the examination of data collected about past events to find patterns, measure performance over time, and inform current and future decisions. It is the foundation of descriptive and diagnostic analysis, and the baseline every predictive model is built on.
The core idea is simple: the past is the most honest evidence you have.
- A store that craters every February
- A cohort that churns 90 days after onboarding
- A vendor whose defect rate climbs each summer
None of these show up in a single live number. They show up across time.
Reading that record well is the whole job, and it is a distinct discipline from broader data analysis.
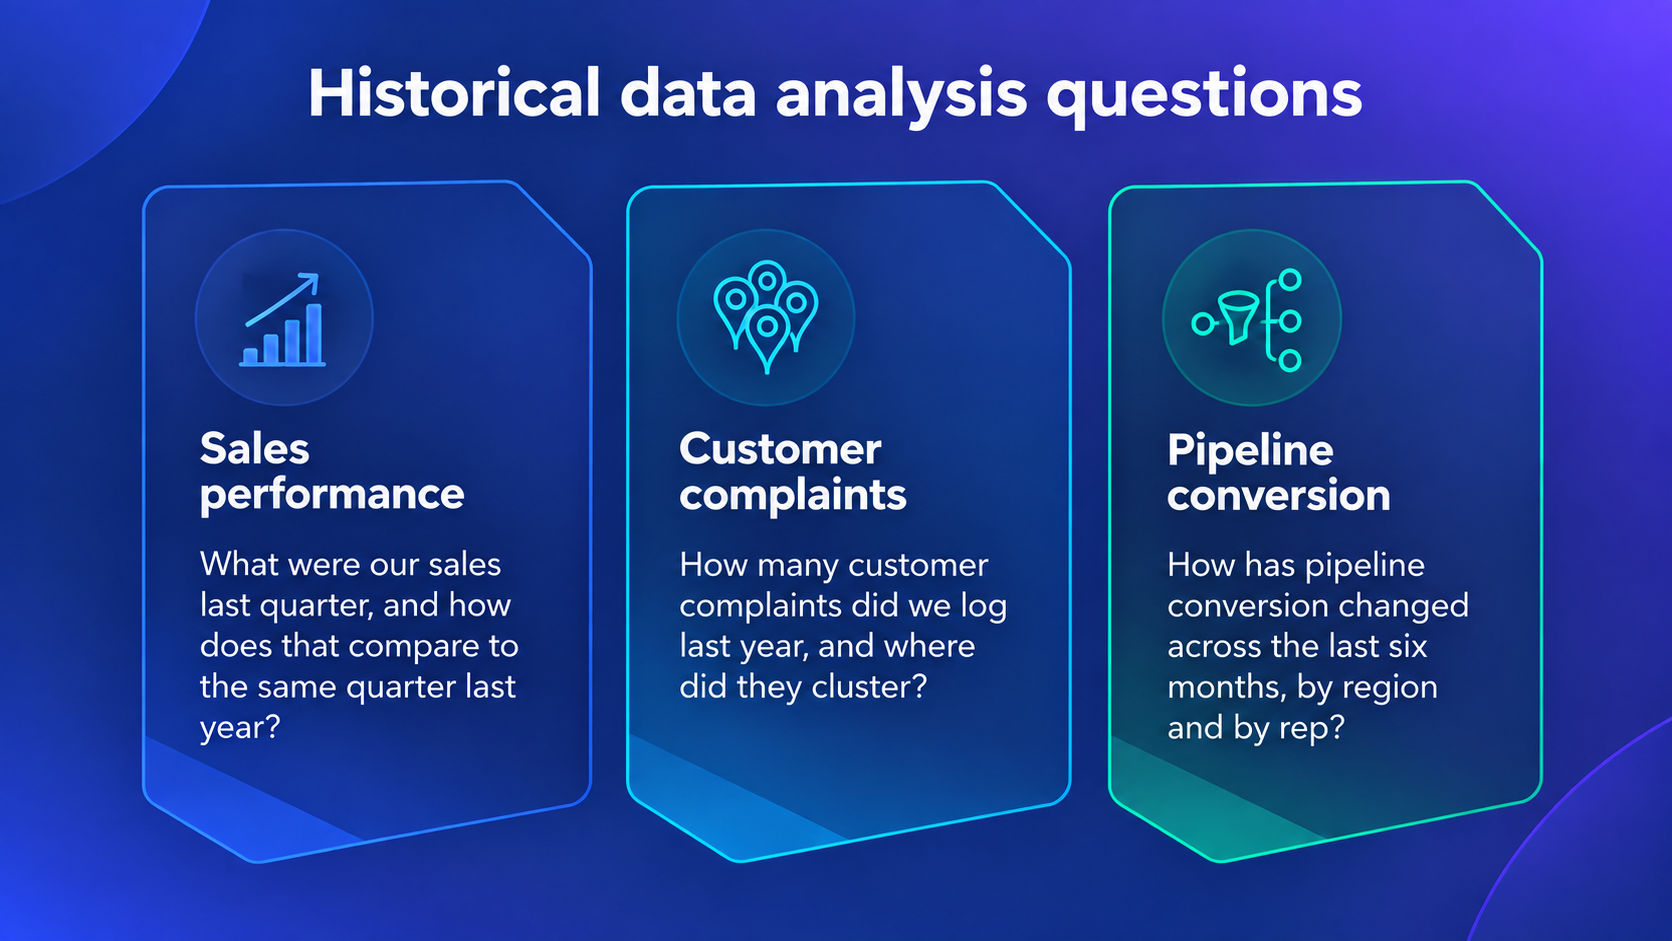
Historical data answers the questions operators actually ask:
- What were our sales last quarter, and how does that compare to the same quarter last year?
- How many customer complaints did we log last year, and where did they cluster?
- How has pipeline conversion changed across the last six months, by region and by rep?
Managers use it to track organizational performance, spot areas to improve, and forecast what comes next.
Why is historical data important for decisions?
Historical data is important because it replaces intuition with evidence. It gives you a benchmark to measure against, a way to see change over time, and the raw material for any forecast worth trusting.
For revenue, marketing, and finance teams, the payoff is concrete:
A benchmark for performance
You cannot know if this month is good without last month, last quarter, and last year to weigh it against.
Change you can see
Quarter-over-quarter and year-over-year comparisons surface growth, decline, and seasonality that a live snapshot hides.
A foundation for forecasting
Every predictive analytics model starts with a clean read of what already happened.
Lower risk
Past mistakes, documented, are mistakes you can avoid repeating.
Every location diagnosed. Every cycle.
Scoop is AI performance management for distributed businesses. It diagnoses performance at every location, every cycle, and hands every manager a clear action plan.
- Every location, every cycle
- Role-specific action plans
- No prompting required
What are the types of historical data?
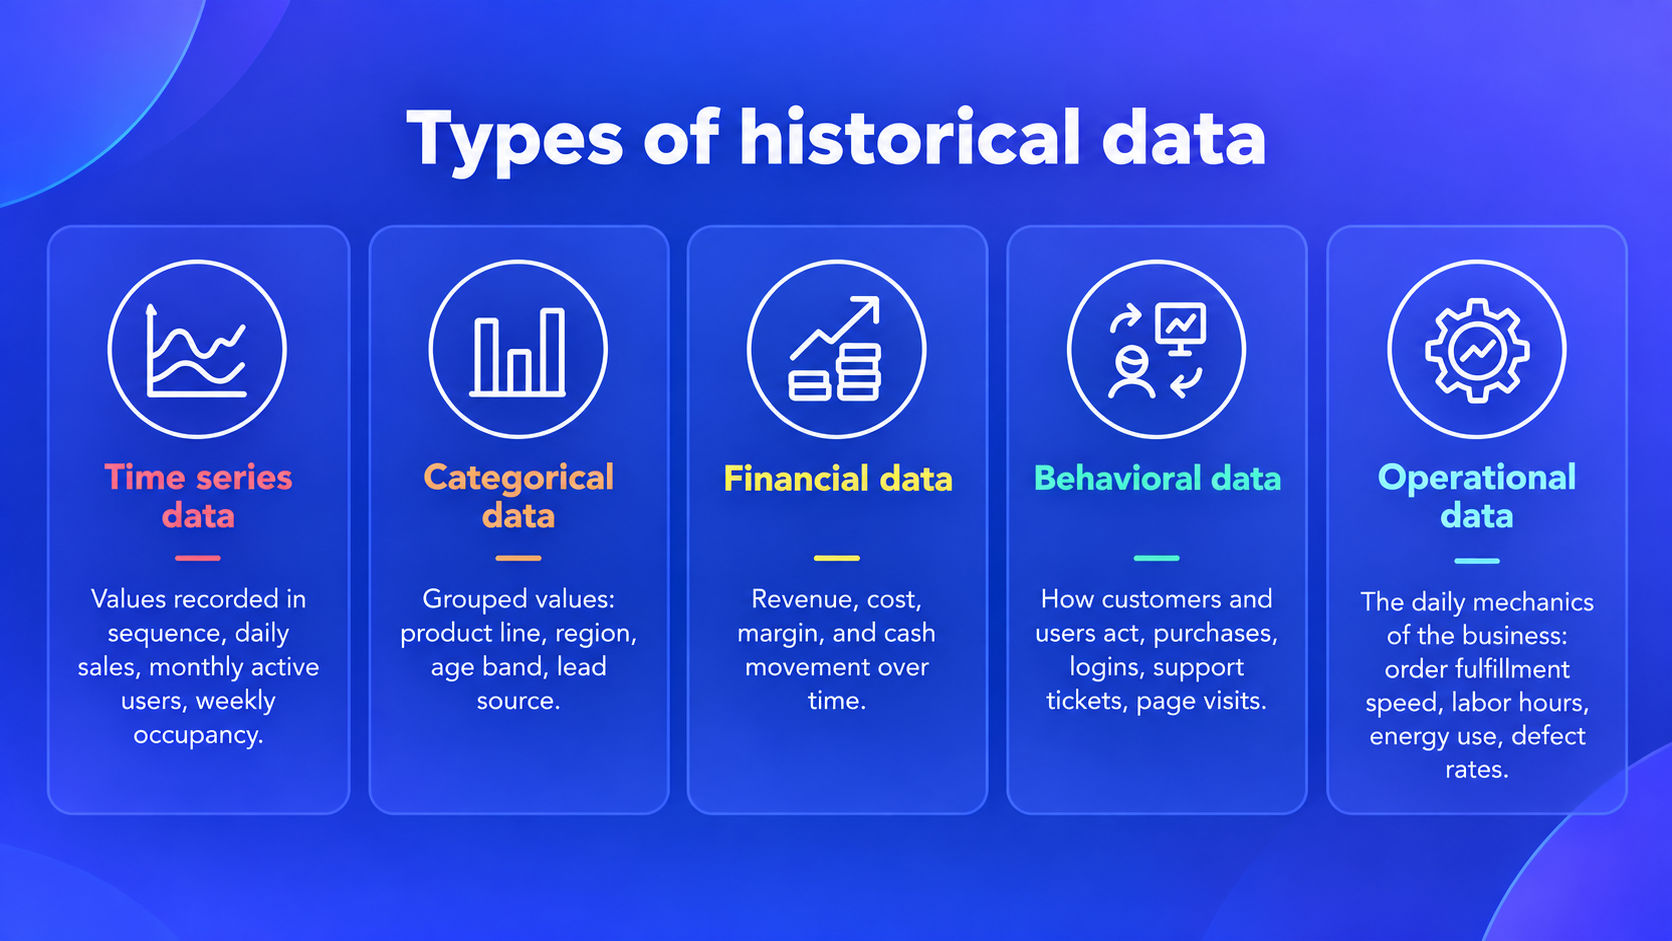
Historical data breaks into five practical types: time series, categorical, financial, behavioral, and operational. Knowing which type you are holding tells you which analysis method fits.
Most business questions pull from more than one type at once. A churn investigation, for example, blends behavioral data (product usage) with financial data (contract value) across a time series (the 90 days before cancellation).
Time series data
Values recorded in sequence, daily sales, monthly active users, weekly occupancy. The backbone of time series analysis and forecasting.
Categorical data
Grouped values: product line, region, age band, lead source. Used to compare performance across segments.
Financial data
Revenue, cost, margin, and cash movement over time. The raw material for P&L trending and cost benchmarking.
Behavioral data
How customers and users act, purchases, logins, support tickets, page visits. The core of cohort analysis and retention work.
Operational data
The daily mechanics of the business: order fulfillment speed, labor hours, energy use, defect rates. Where multi-location performance problems hide.
What are the methods for analyzing historical data?
The main methods are descriptive, diagnostic, predictive, and prescriptive analysis, supported by trend analysis, comparative analysis, cohort analysis, and anomaly detection. Each answers a different question about the same history.
Think of them as a ladder. Descriptive tells you what happened. Diagnostic tells you why.
Predictive tells you what is likely next. Prescriptive tells you what to do.
Descriptive analysis vs Diagnostic analysis
Knowing the split between descriptive vs diagnostic analytics is the difference between a chart that reports a dip and an analysis that explains it. For change over time specifically, trend analysis isolates the direction; anomaly detection flags the outliers that do not fit it.
Where the history is deep and the variables are many, machine learning in data analytics can look at ten to twenty variables at once and surface differences a two-dimensional drill would never catch.
Codify what your best operators already know.
Scoop captures your operators' tribal knowledge, screens every location automatically, and delivers role-specific action plans. Nobody writes a prompt. The plan just arrives.
- Codified tribal knowledge
- Automatic screening
- Action plans, not dashboards
What are data snapshots, and why do they matter?
A data snapshot is a frozen, point-in-time record of your key metrics. Snapshots make historical analysis reliable because they capture what the data actually said on a given day, before anyone overwrote it.
A CRM shows the current state of every deal. It does not remember what the pipeline looked like six weeks ago, because records update in place.
When a deal moves from "negotiation" to "closed lost," the earlier state is gone. Without snapshots, you cannot reconstruct history, you can only see now.
Snapshots fix that by freezing the record on a schedule. The benefits stack up fast:
- Data integrity: Snapshots capture unaltered data, so no retroactive edit can quietly rewrite your history.
- True comparison: Real quarter-over-quarter and year-over-year reads, because you have the actual past state, not a reconstruction.
- Trend clarity: Seasonality and drift become visible when every period is preserved. This is the base layer for change analysis that holds up.

How do RevOps teams use historical data to refine the opportunity lifecycle?
RevOps teams use historical data to see how deals actually move through the pipeline, where they stall, and which stages leak, then reset the lifecycle around what the evidence shows instead of what the CRM assumes.
This is the highest-value use of historical data for a revenue team, and most stacks handle it badly.
Your CRM tells you where deals are today. It does not tell you how long they sat in "proposal" before they died, or which lead source produces deals that close fast versus deals that rot.
That pattern lives in the history, and you can only read it if you captured it.
Opportunity lifecycle workflow:
- Snapshot the pipeline on a schedule: Freeze every open opportunity, weekly, so stage, value, and age are preserved
- Measure real stage duration: Run sales cycle analysis against the snapshots to find where deals actually slow down
- Segment by cohort: Group deals by source, segment, or quarter and compare conversion with cohort analysis for RevOps to see which cohorts behave differently
- Redraw the lifecycle: Reset stage definitions, exit criteria, and forecasts around what the history proves, feeding cleaner inputs into predictive sales forecasting
Live in weeks. Not months.
We connect to your data, codify your playbook, and train your team. You see a working pilot before anyone commits to a full rollout.
- Connect your data
- Codify your playbook
- Pilot before rollout
What are the steps in conducting historical data analysis?
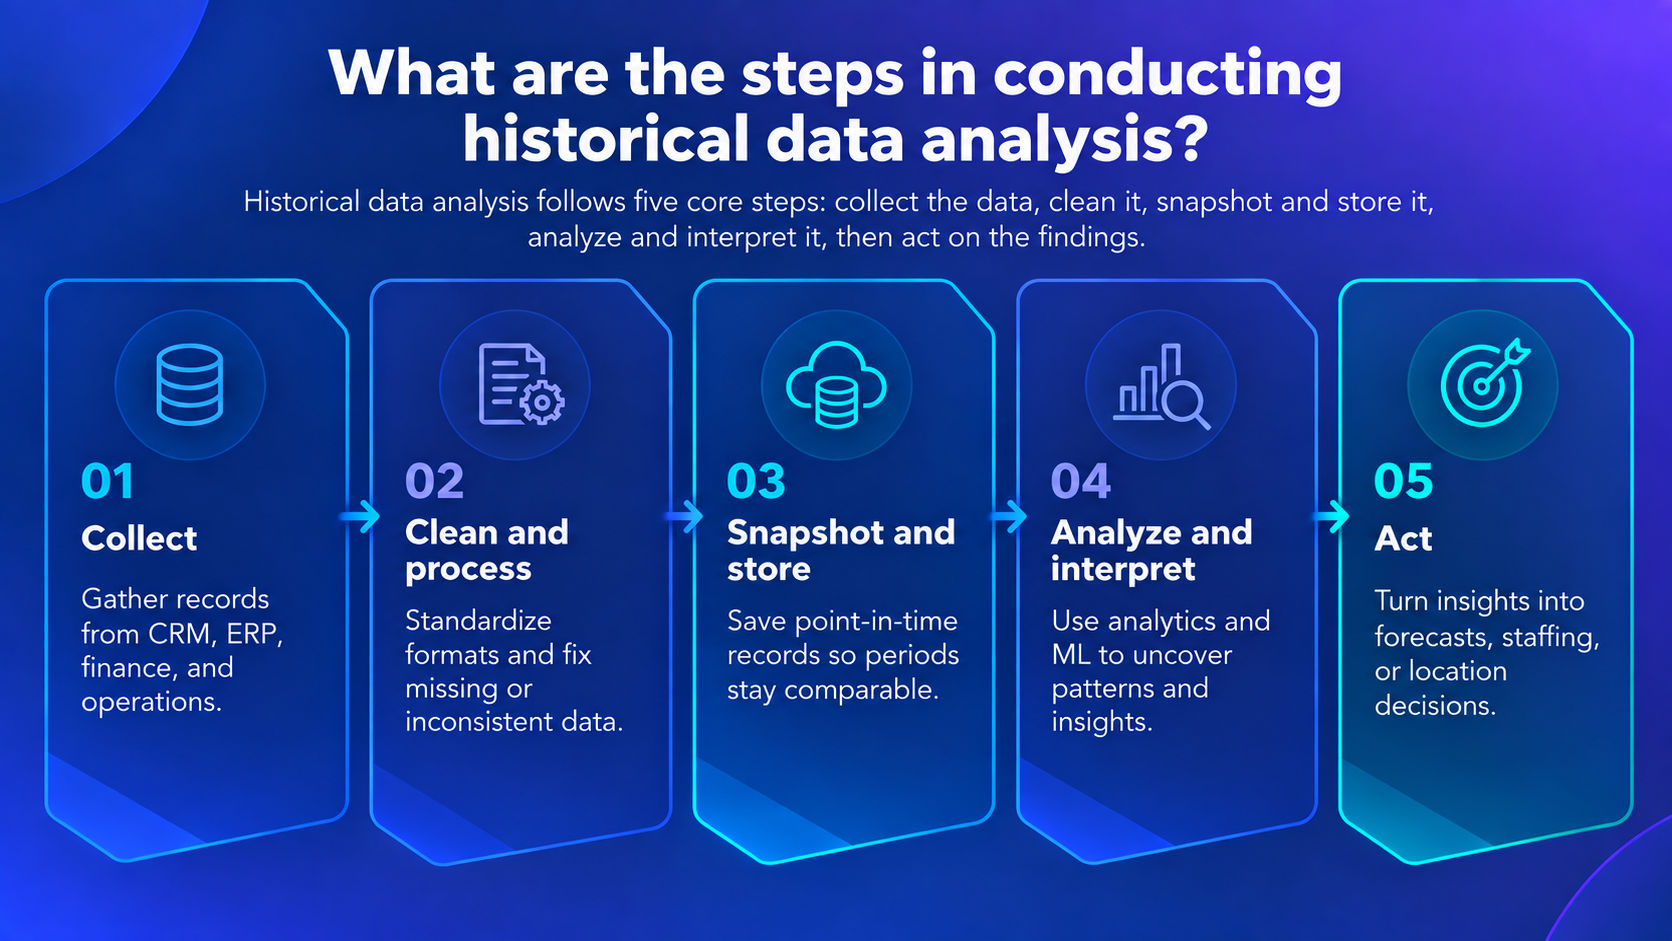
Historical data analysis follows five core steps: collect the data, clean it, snapshot and store it, analyze and interpret it, then act on the findings. Skip the middle and the analysis inherits every error in the source.
1. Collect:
Gather accurate, comprehensive records from CRM, ERP, finance, and operational systems.
2. Clean and process:
Remove inconsistencies, reconcile formats, and handle missing values before anything else. Garbage history produces confident, wrong conclusions.
3. Snapshot and store:
Preserve point-in-time records on a schedule so periods stay comparable.
4. Analyze and interpret:
Apply the methods above, descriptive through prescriptive, plus ML where the variable count justifies it.
5. Act:
Turn the read into a decision: a reset forecast, a staffing change, a flagged location. Analysis that ends in a chart ends too early.
What are the challenges in historical data analysis?
The main challenges are incomplete or inaccurate data, missing point-in-time history, and context that does not carry forward. Each one quietly distorts the conclusion if you do not plan for it.
Incomplete or inaccurate data
Missing points skew everything downstream, which makes data quality management non-negotiable, not a nice-to-have.
No history to read
Systems that update in place erase the past. If you did not snapshot it, you cannot analyze it. This is the most common and most preventable gap.
Contextual limits
Past patterns do not always predict the future when market conditions shift. History informs the forecast; it does not guarantee it.
The interpretation gap
The hardest challenge is not producing the analysis. It is that the person reading the report often cannot tell what it means or what to do next.

How to use AI performance management in historical data analysis
AI closes the interpretation gap. This is the shift from BI that reports history to AI performance management: a layer that reads the full history across every location, explains why the numbers moved, and hands each role a recommended action.
The report does not just show what happened. The report tells you what to do.
A dashboard shows a dip and leaves you to investigate. AI performance management investigates the dip the way your best operator would, because it runs on their logic:
- Testing what changed
- Checking the drivers
- Surfacing the one that matters most
This is not generic AI let loose on your data. Scoop captures how your most experienced operator actually reads the business, then runs that judgment everywhere. The capture is literal:
If we took a tape recorder and recorded everything you thought as you looked at your BI reports, we stick that into the system so it can do that on your behalf.
That codified judgment becomes the guardrails. The system runs on a schedule against your history and works like this:
- Screen every location or segment against the criteria that matter: year-over-year deviations, ratios out of balance, early-warning signals.
- Flag and investigate the ones that trip a screen, spawning a focused set of probes into that unit.
- Analyze with ML across many variables at once to find the real driver, not the obvious one. This is where machine learning fused with LLMs earns its place.
- Synthesize and roll up so each role sees a view scored from critical to healthy, from store to region to organization.
The payoff is adherence. Best practices get set, then things unravel. AI performance management watches every location against your standards every cycle and flags the moment one starts to drift, before it reaches the P&L. It is your best operator reviewing every location, every cycle, without adding a single hour of anyone's time.
It sits on top of the data warehouse and BI you already run, Power BI, Tableau, a warehouse, spreadsheets, and adds the interpretation and action layer to your existing BI stack. Nothing gets ripped out. The point is captured well by one operator who wanted, in his words:
A mini version of that person in a box, scanning and analyzing every week on their behalf.
That is the shift: from a history you interpret by hand to a history that is read for you, every cycle.
Built for the businesses that run everywhere at once.
Scoop exists to bring best-in-class operational diagnostics to every distributed business, not just the ones big enough to staff a team for it. Meet the people building it.
- Operator-first by design
- Built for distributed teams
- Diagnostics, not dashboards
Frequently asked questions about Historical Data Analysis
What is historical data?
Historical data is data collected about past events and circumstances, sales records, transactions, logs, communications, and reports generated across the business over time. It is the primary reference for understanding patterns, and the foundation of both descriptive analytics and prediction.
What are some examples of historical data?
Common examples include quarterly sales figures, monthly active users, customer support tickets over a year, closed-won and closed-lost deals by source, occupancy rates by month, and P&L line items across several years. Anything documented over time that can be referenced and compared counts.
- Time-stamped sales, revenue, and margin records
- Customer behavior: purchases, logins, tickets, renewals
- Operational logs: labor hours, fulfillment times, defect rates
What are the two sources of historical data?
Historical data comes from two sources: primary (data your business generates itself, CRM, ERP, transaction logs, internal reports) and secondary (external data you bring in, market benchmarks, industry indices, public records). Primary sources tell you what happened inside the business; secondary sources tell you how that compares to the outside world.
What are the 5 main types of data analysis?
The five main types are descriptive (what happened), diagnostic (why it happened), predictive (what is likely next), prescriptive (what to do), and exploratory. The last one, covered in this guide to exploratory data analysis, is where you discover patterns without a fixed hypothesis. Historical data feeds all five.
What are the 7 stages of data analysis?
Expanded from the five core steps in this article, the seven stages are: define the question, collect the data, clean and process it, snapshot and store it, analyze it, interpret the results, and act on them. The middle stages, cleaning and snapshotting, are the ones teams skip and later regret, because every downstream conclusion inherits their errors.
For teams building repeatable reporting on top of this, prescriptive analytics is the stage that turns interpretation into a recommended action.