
"One person who sees what's coming six months out — we're trying to scale that person."— COO, national retail chain
That quote captures a problem most operations leaders know but rarely name: the people who can read customer data and actually understand what it means don't scale. Dashboards don't either.
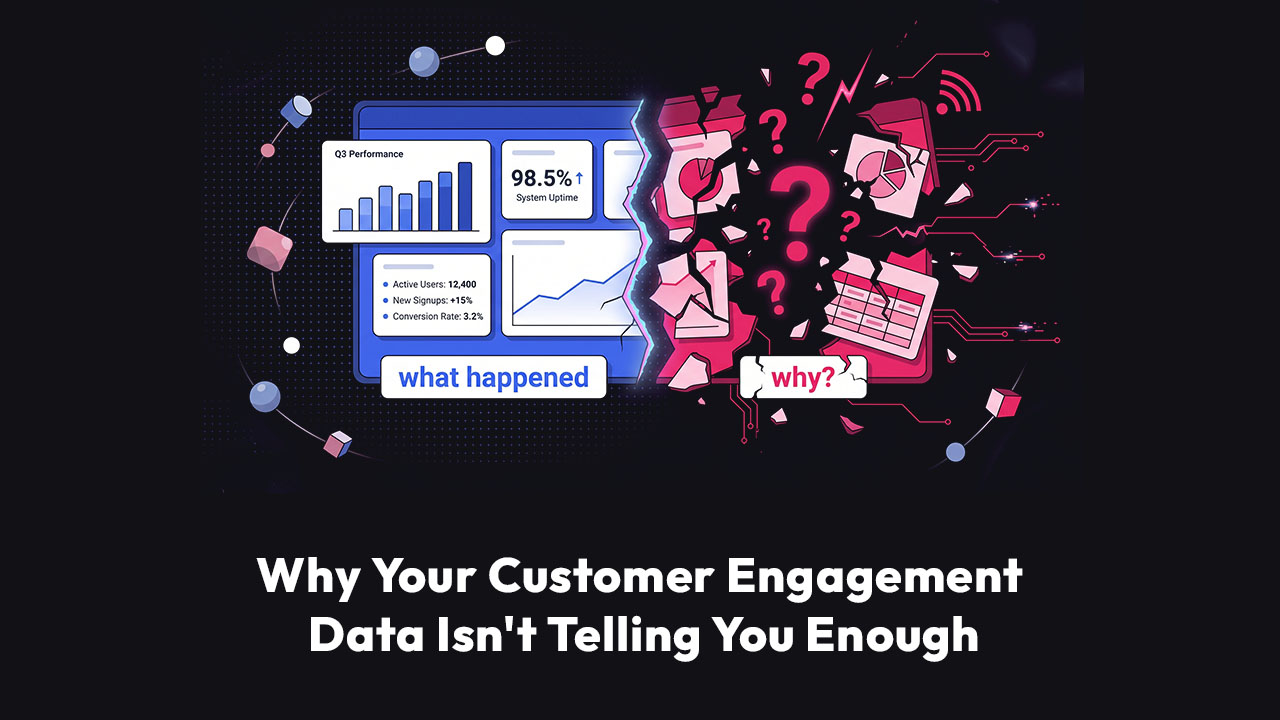
Customer engagement data has never been more abundant. And yet businesses keep getting caught off guard — loyalty programs underperforming, visit frequency dropping, basket sizes shrinking — by the time it shows up clearly on a report, it's already a problem.
The issue isn't a lack of data. It's a gap between what dashboards show and what your team actually needs to know.
What Is Customer Engagement Data?
Customer engagement data refers to the signals a business collects that reflect how customers are interacting with a brand over time. This includes transaction frequency, loyalty tier activity, return rates, visit patterns, support interactions, and behavioral signals across channels.
"Customer engagement is at the heart of business growth — it encompasses how customers interact with your brand, what they expect from those interactions, and how those experiences influence their loyalty."— involve.me, 100+ Customer Engagement Statistics 2026
According to Salesforce's State of the Connected Customer, 88% of customers say the experience a company provides is as important as its products or services. And yet most businesses are still measuring engagement with metrics that show activity, not intent or risk.
PwC's research on customer experience frames this as the era of the "always-on customer" — one whose behaviors, preferences, and signals are generating data continuously. The challenge isn't collecting that data. It's knowing what to do with it.
There's a difference between tracking engagement and understanding it. Most teams are doing the first. Very few are doing the second.

The 4 Metrics That Actually Matter Operationally
When it comes to customer engagement analytics, most guides point to the same list: NPS, CSAT, retention rate, lifetime value. These are real metrics. But for ops leads and analysts who need to act — not just report — these numbers are lagging indicators. By the time they shift meaningfully, the damage is already done.
"Customers' standards keep rising — 73% of customers expect better personalization as technology advances, and 65% expect companies to adapt quickly to their needs and preferences. Unfortunately, 61% feel that most companies still treat them like numbers rather than individuals."— involve.me, 100+ Customer Engagement Statistics 2026
The four metrics that carry operational weight are different in character:
1. Loyalty tier movement.
Not just whether customers are enrolled in a loyalty program, but whether they're migrating up, holding steady, or quietly dropping tiers. Tier movement is a leading signal. Revenue change is a trailing one.
2. Visit frequency delta.
Not the average visit frequency across all customers, but which specific segments are visiting less often this period compared to the same period last year — and whether that shift is tied to a campaign, a product change, or something else entirely.
3. Basket composition change.
Customers who are disengaging often don't disappear overnight. They start buying fewer categories, smaller quantities, or lower-margin items before they stop coming altogether. That pattern is visible in the data before churn materializes.
4. Segment-level behavioral variance.
The most actionable signal is often comparative. If one customer segment is holding engagement steady and another is declining, something specific is driving that divergence. The question is what.
Harvard Business Review has consistently found that increasing customer retention by just 5% can boost profits anywhere from 25% to 95%.
KPMG's customer loyalty research reinforces this: even a 2–3% retention lift can translate into double-digit revenue growth. The math makes investigating engagement signals early — not reactively — one of the highest-leverage activities an ops team can run.

Why Dashboards Create a False Sense of Visibility
Here's the honest problem: most BI tools are built to show you what happened. They're not built to tell you why, or what to do next.
"Marketers must listen for the signals that indicate customers are ready to engage and design programs that respond to those signals quickly. This requires both advanced customer analytics to read the signs of customer intent and a response system that reacts to those signs by reaching out with relevant customer content across touchpoints and channels."— McKinsey & Company
A dashboard can surface the fact that customer retention dropped 12% year-over-year in a specific segment.
What it can't do — at least not automatically — is connect that drop to a specific cause. Was it a loyalty tier issue? A product mix shift? A campaign that resonated with the wrong audience? A cohort that aged out of the core profile?
Those questions require investigation, not just reporting. And investigation requires someone willing to go beyond the chart and actually interrogate the data.
This is the investigation gap. It's the space between what is business intelligence and what modern ops teams actually demand from their tools.
McKinsey's research on analytics-driven organizations consistently points to the same finding: companies that use analytics to investigate root causes outperform those that simply report on outcomes.
The tools exist. The gap is between collecting data and acting on what it means.
The Problem with "More Data"
The intuitive response to blind spots is to collect more data. More sources, more dashboards, more reports. In practice, this usually makes things worse.
"Without the ability to access and act on detailed customer insights, marketers cannot optimize the customer experience — a critical component of their marketing success."— VWO, 50+ Essential Customer Engagement Statistics
More data without a framework for investigating it creates noise. Gartner has noted that the majority of analytics insights never actually influence business decisions. The issue isn't output volume — it's interpretability and actionability.
Deloitte's analytics research identifies a consistent pattern: organizations that invest in interpretation infrastructure — the ability to explain why a metric moved — outperform those focused on expanding data collection alone.
That's exactly where customer segmentation and on-demand analysis become operationally essential — not nice-to-have. Understanding what customer segments actually are is the foundation. Acting on how those segments are shifting in real time is the work.
What Root Cause Investigation in Customer Data Actually Looks Like
Let's make this concrete. An ops team notices year-over-year revenue decline within a specific customer segment. The dashboard confirms the trend. It doesn't explain it.
A proper investigation runs multiple parallel lines of inquiry: comparing performance by loyalty tier, by transaction type, by cohort age, by acquisition channel, by product category. The answer isn't obvious from any single slice. It emerges from testing hypotheses against the available data simultaneously — asking "what explains this?" rather than "what does this show?"
The kind of analysis that matters is not about adding more charts. It's about asking better questions of the data you already have.
"Companies that excel at personalization are 71% more likely to report improved customer loyalty as a result. When customers feel a brand truly knows them, they stick around longer."— involve.me, 100+ Customer Engagement Statistics 2026
That connection between understanding your customer segments and acting on what drives them is exactly where most analytics workflows break down.
The data exists. The investigative layer — the ability to ask why and get a real answer quickly — is what most ops teams are missing.
Understanding customer churn signals before they become visible in revenue is possible. But only if the team has a way to surface leading indicators, not just report trailing ones.
The Loyalty Gap Nobody Talks About
Bain & Company's foundational work on customer loyalty established that acquiring a new customer costs five to seven times more than retaining an existing one. Most ops teams know this number. Few have the workflow to act on it systematically.
"Retention may not grab headlines, but it drives ROI like nothing else. Reinvesting in loyalty programs, communities, and post-purchase engagement creates compounding returns over time."— Insider One, 20+ Customer Engagement Statistics 2026
The problem is structural. Loyalty analysis typically happens after the fact — a quarterly review, an annual cohort study, a report that surfaces trends that are already months old. By the time the pattern is visible at the team level, it's already priced into performance.
Accenture's research on the Switching Economy frames this clearly: consumer spending preferences have created a massive opportunity for brands that act on disengagement signals fast.
The brands losing share aren't losing it all at once. They're losing it in small, early signals that nobody is investigating.
Customer health score frameworks help surface those signals. But a health score without root cause logic is still a lagging indicator. The question isn't just is this customer at risk — it's why, and what specifically needs to change.
What a Better Workflow Actually Looks Like
The ops leads and analysts who catch customer engagement problems early share a common habit: they don't wait for the quarterly review. They ask the question when the signal first appears.
That means having a tool that lets you go from a metric shift to a root cause investigation without a data request, without SQL, and without waiting for an analyst to free up time.
It means being able to blend your CRM data, your transaction history, and your engagement metrics in one place and ask a direct question: why is this segment behaving differently?
"Data will become the new creative edge. The brands winning will be those turning insights into action in real time — not those collecting the most data."— Insider One, Key Trends Defining Customer Engagement in 2026
Scoop's AI data analyst is built for exactly this kind of on-demand investigation. Connect your data sources, ask the question in plain language, and get an answer with the statistical logic behind it — not just a chart.
No coding. No IT queue. No waiting.
For teams that track customer success metrics alongside engagement data, Scoop's customer success analytics brings both together so the full picture is visible in one place.
The Question Worth Asking
Most businesses assume they have a data problem. They need more sources, better dashboards, faster reports. Usually, that's not the real issue.
The real issue is the investigation gap. Data exists. The capacity to interrogate it on demand — for any segment, any time window, any question — is what most ops teams are actually missing.
According to Forrester, companies that are genuinely customer-obsessed report significantly higher loyalty, retention, and revenue growth than peers. The differentiator isn't access to data. It's the ability to act on what the data is actually saying.
That's the level of intelligence your customer engagement data should be delivering. If it isn't, the gap isn't in your data — it's in how it's being investigated.
Frequently Asked Questions
What is customer engagement data?
Customer engagement data encompasses the behavioral, transactional, and attitudinal signals that reflect how customers interact with a business over time. It includes loyalty activity, purchase frequency, basket size, visit patterns, and channel interactions.
What are the most important customer engagement metrics for ops teams?
Loyalty tier movement, visit frequency delta by segment, basket composition shifts, and segment-level behavioral variance are the leading indicators with the most operational leverage. Lagging metrics like NPS and retention rate confirm problems that leading metrics can surface weeks or months earlier.
Why don't dashboards surface customer engagement problems early enough?
Dashboards are designed to report on outcomes. They show what happened. Surfacing the root cause of a trend — why loyalty is declining in a specific segment, for example — requires active investigation across multiple variables simultaneously. That's a different capability than reporting.
What is the investigation gap?
The investigation gap is the space between having data and understanding what the data means. It's the difference between a dashboard that shows a metric changed and an analytics tool that explains what drove the change and what to do next.
How can ops teams investigate customer engagement without a data analyst?
Modern analytics tools like Scoop allow ops leads to connect their data sources, ask questions in plain language, and get statistically grounded answers without writing code or submitting a data request. The key is having a tool built for investigation, not just visualization.
Why is customer retention more valuable than acquisition?
Research from Bain & Company and Harvard Business Review consistently shows that retaining an existing customer costs five to seven times less than acquiring a new one, and a 5% improvement in retention can yield 25–95% profit growth. Investing in early engagement signal investigation is an investment in retention.
Conclusion
Customer engagement data is not the same as customer engagement intelligence. Most teams have the first. Very few have the second. The difference is an investigation layer — something that lets you ask why, get a real answer, and act before the metric becomes a crisis.
If your current stack shows you what happened but leaves the why to interpretation and guesswork, you're already operating at a disadvantage. The teams pulling ahead aren't collecting more data. They're investigating it better.
Start a free trial of Scoop and start getting real answers from your customer engagement data today.


