

See Scoop in action
Bring your data to life with AI-powered presentations—start your free trial of Scoop.

Sheetlets
Snapshotting and Process Analysis
Advanced Styling
Cohort Analysis
Performance Overview
Adjusted Forecast
Sales Pipeline
Open Deal Distribution
Explore Predictors
.webp)
Insert pre-built, modular data visuals into reports for quick, customizable insights.
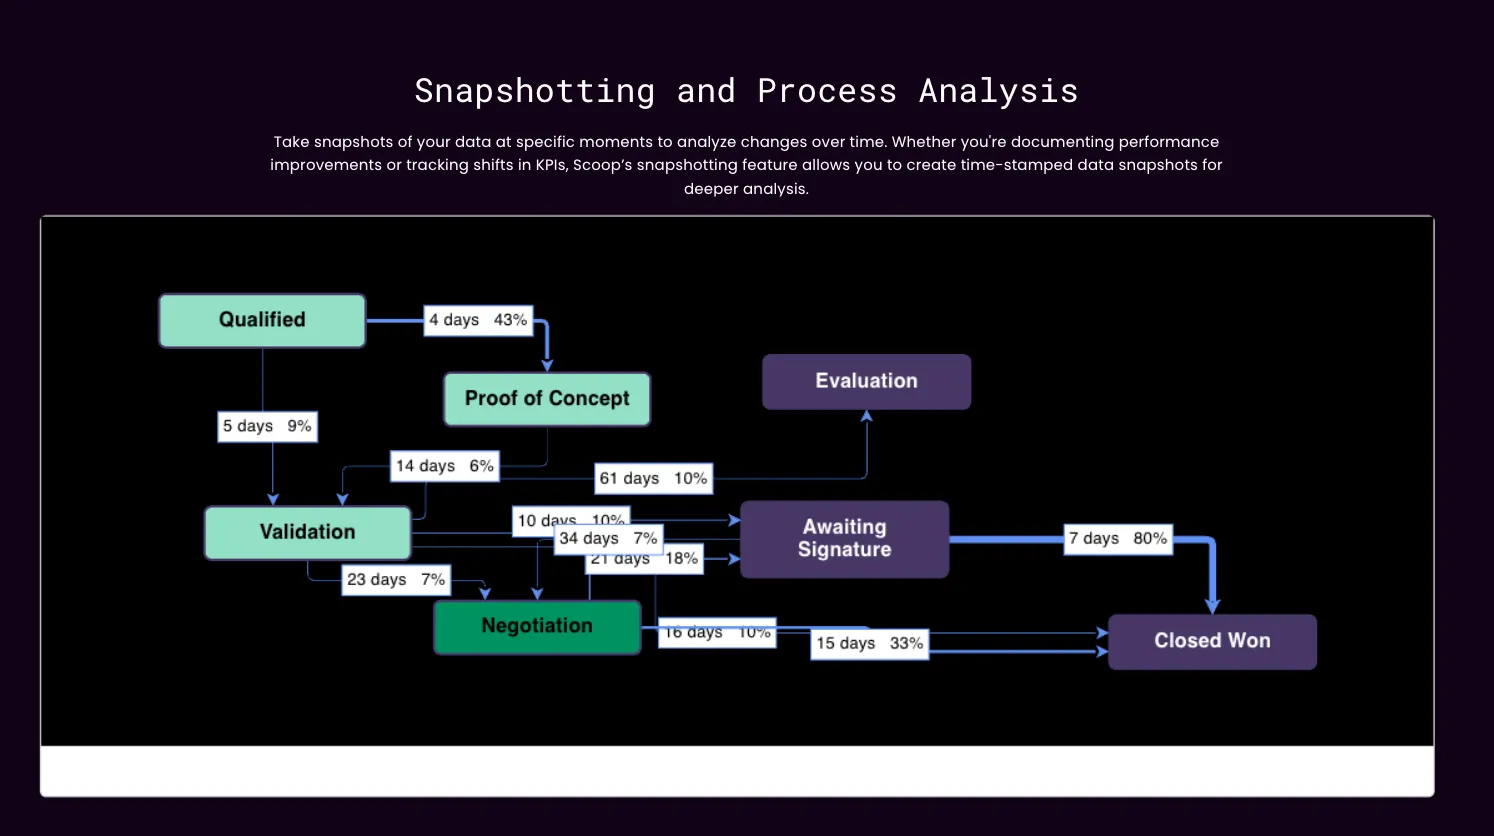
Track data changes over time and analyze workflows to identify trends and optimize processes.
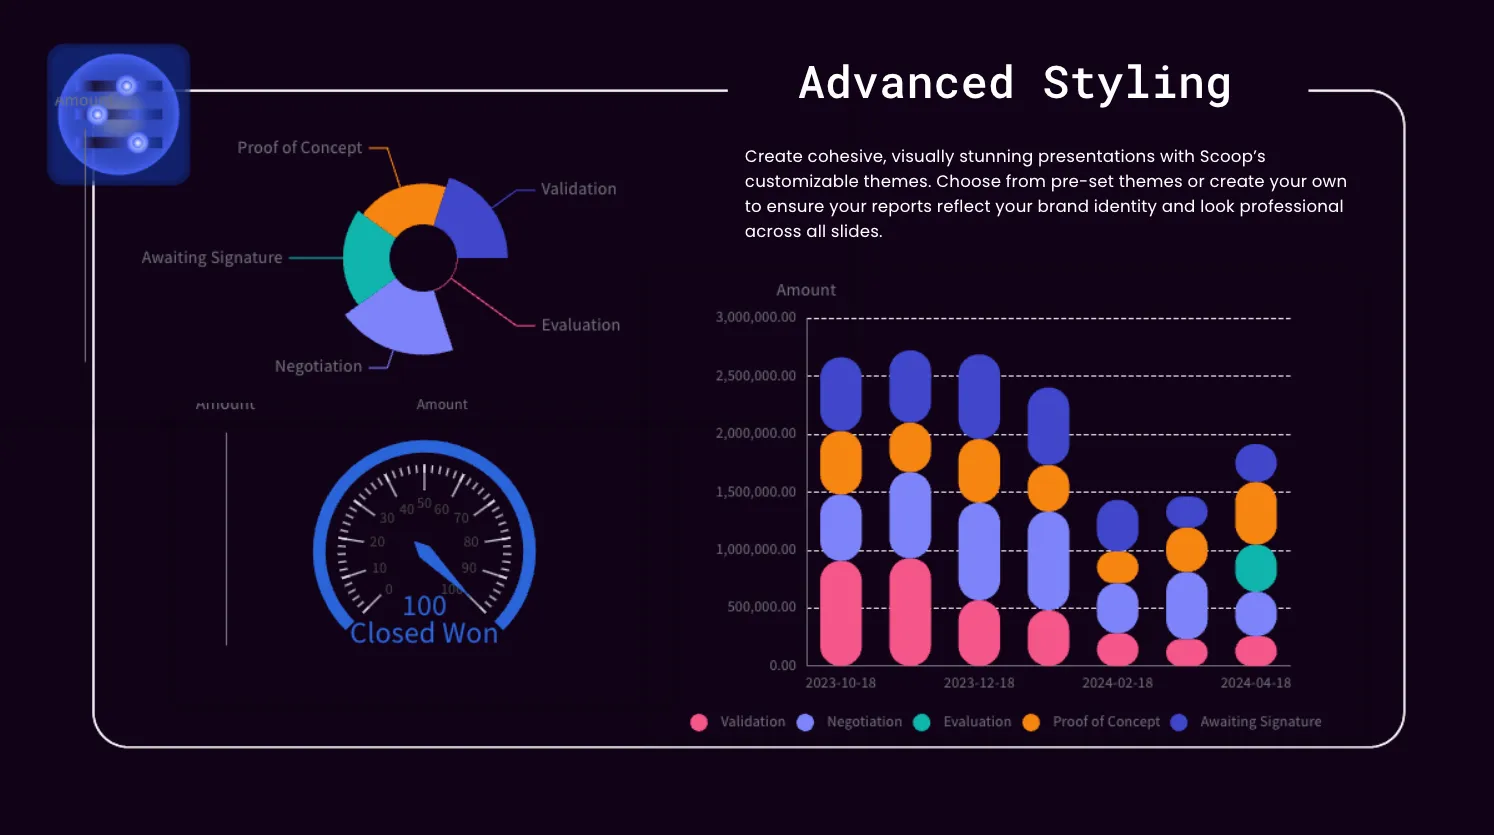
Customize fonts, colors, and layouts in Scoop Analytics for visually tailored reports and dashboards.
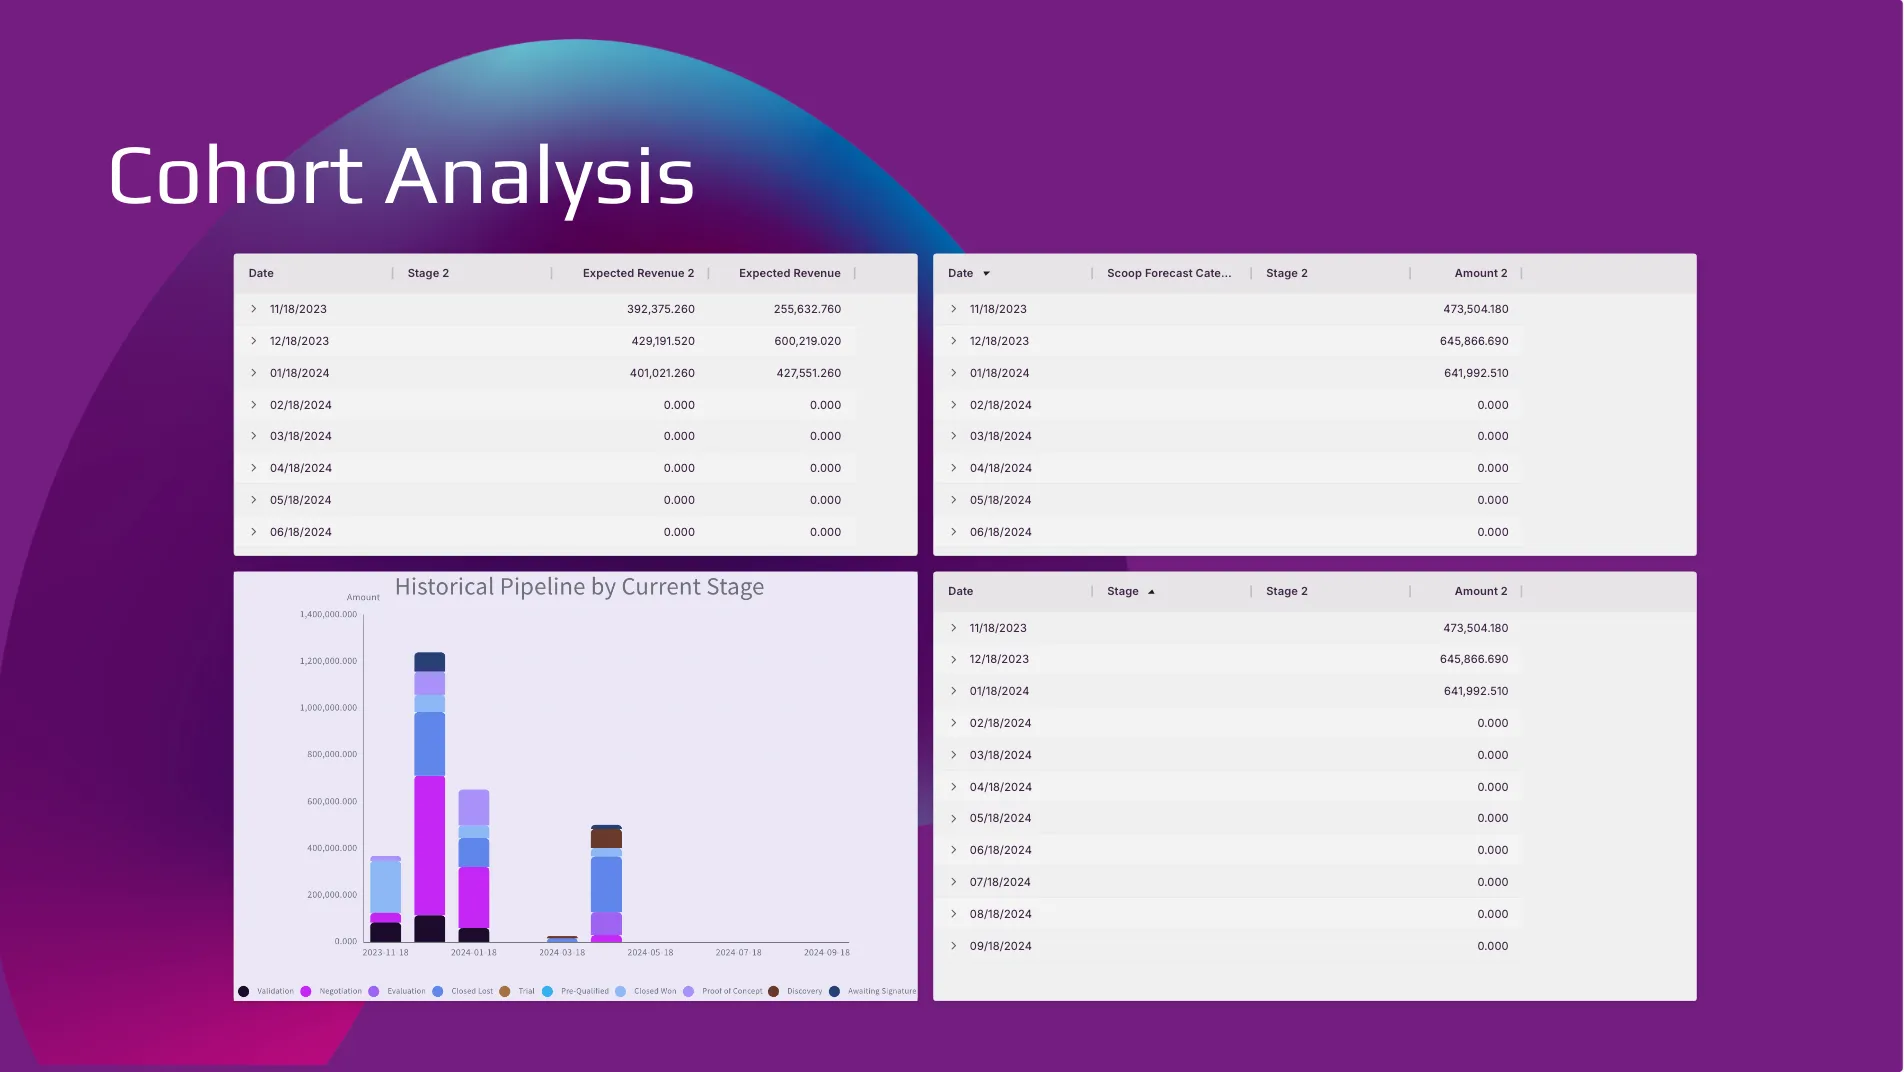
Segment data by shared traits over time to uncover trends, retention, and performance insights.
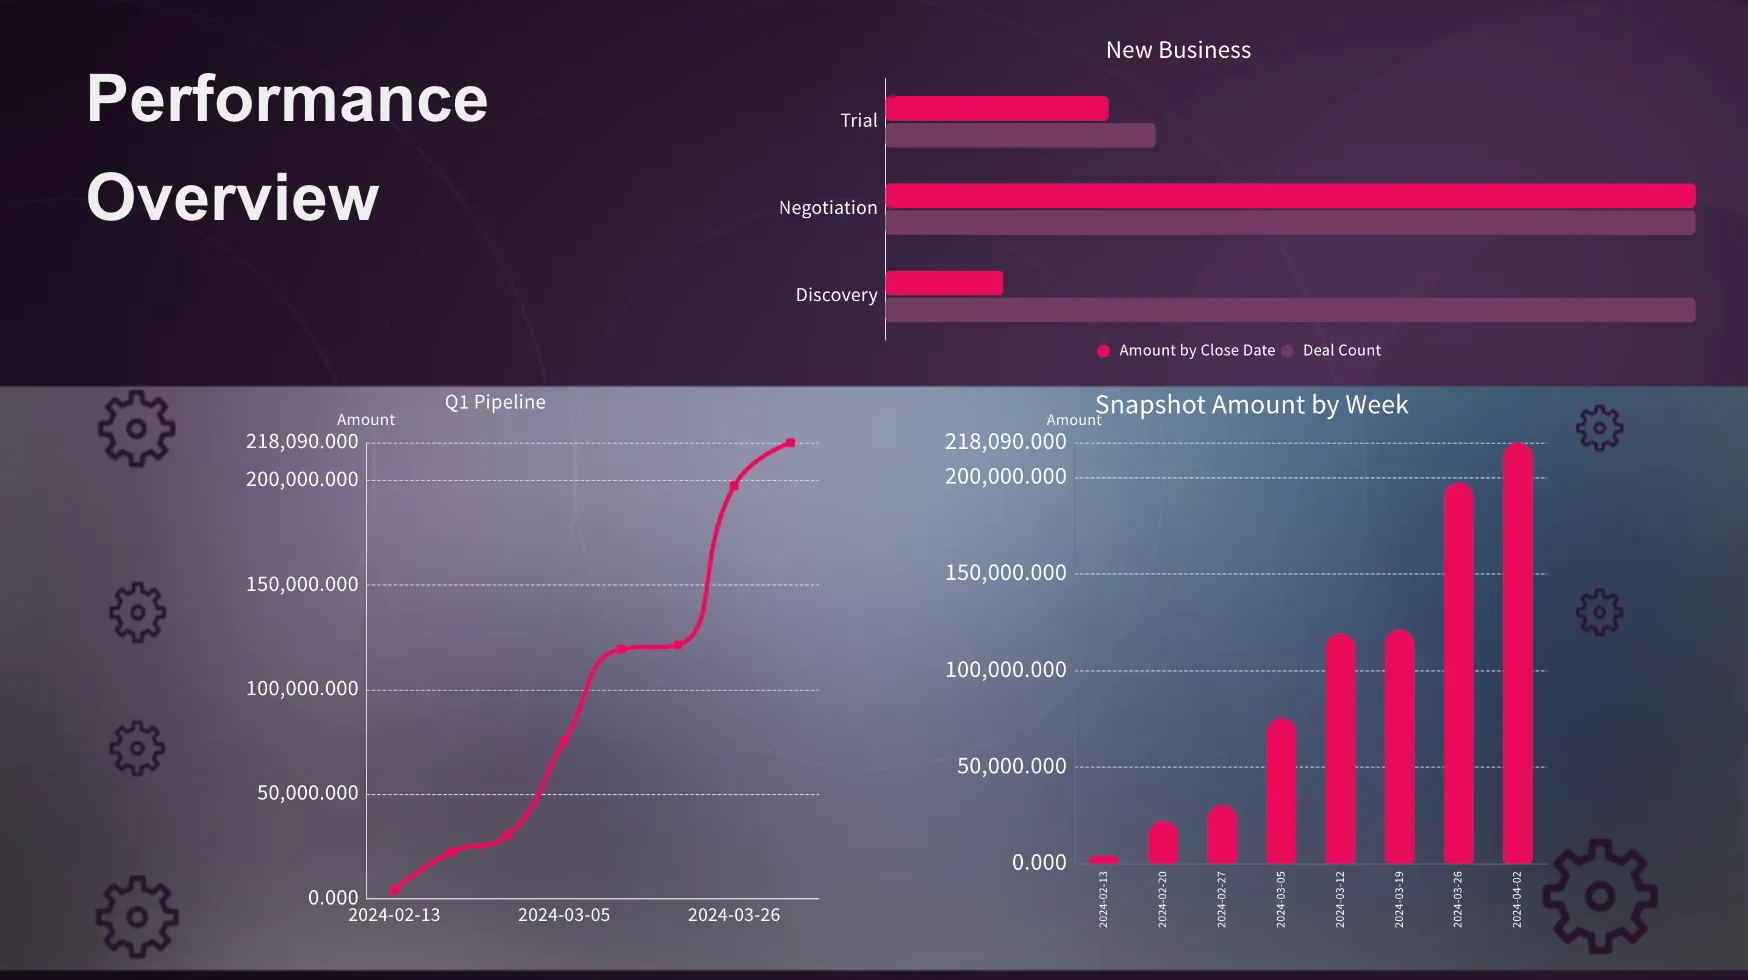
Get a quick view of key metrics and KPIs to assess business health and progress.
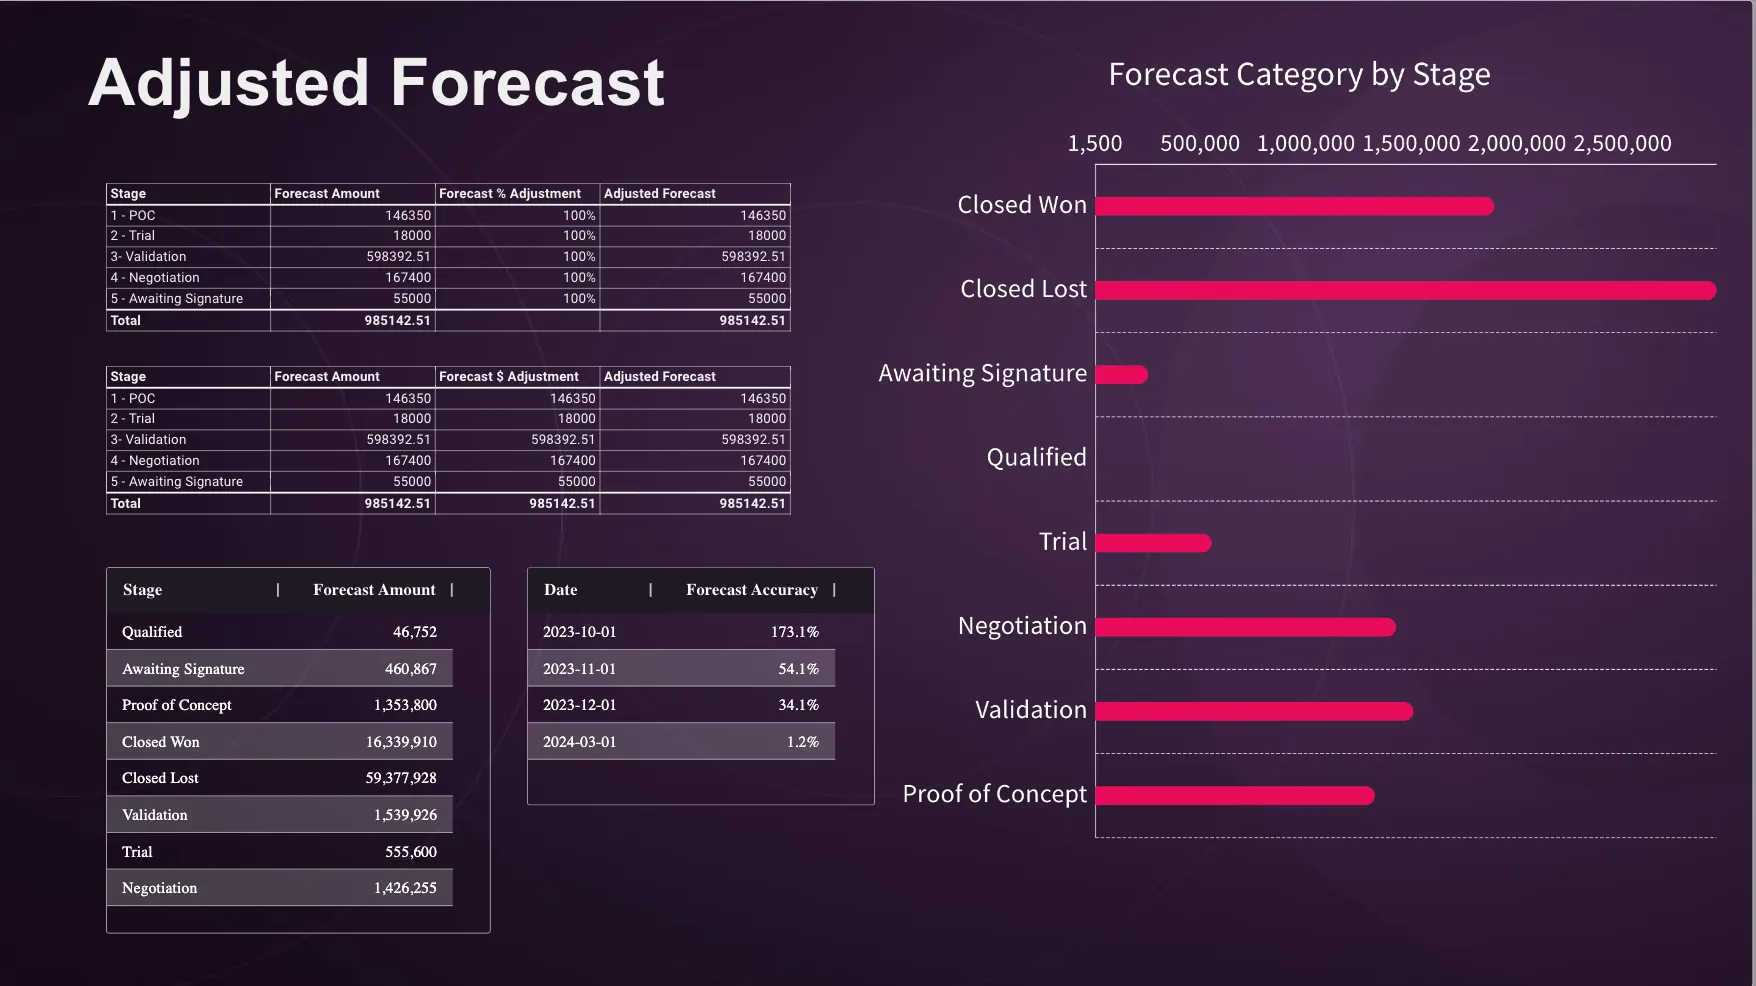
Refine forecasts using real-time data and updated assumptions for more accurate predictions.

Track and visualize every stage of your sales process, from lead generation to deal closure, for better pipeline management and forecasting.

Distribute open deals to your team in just a few clicks with our instant recipe and your preferred data source.
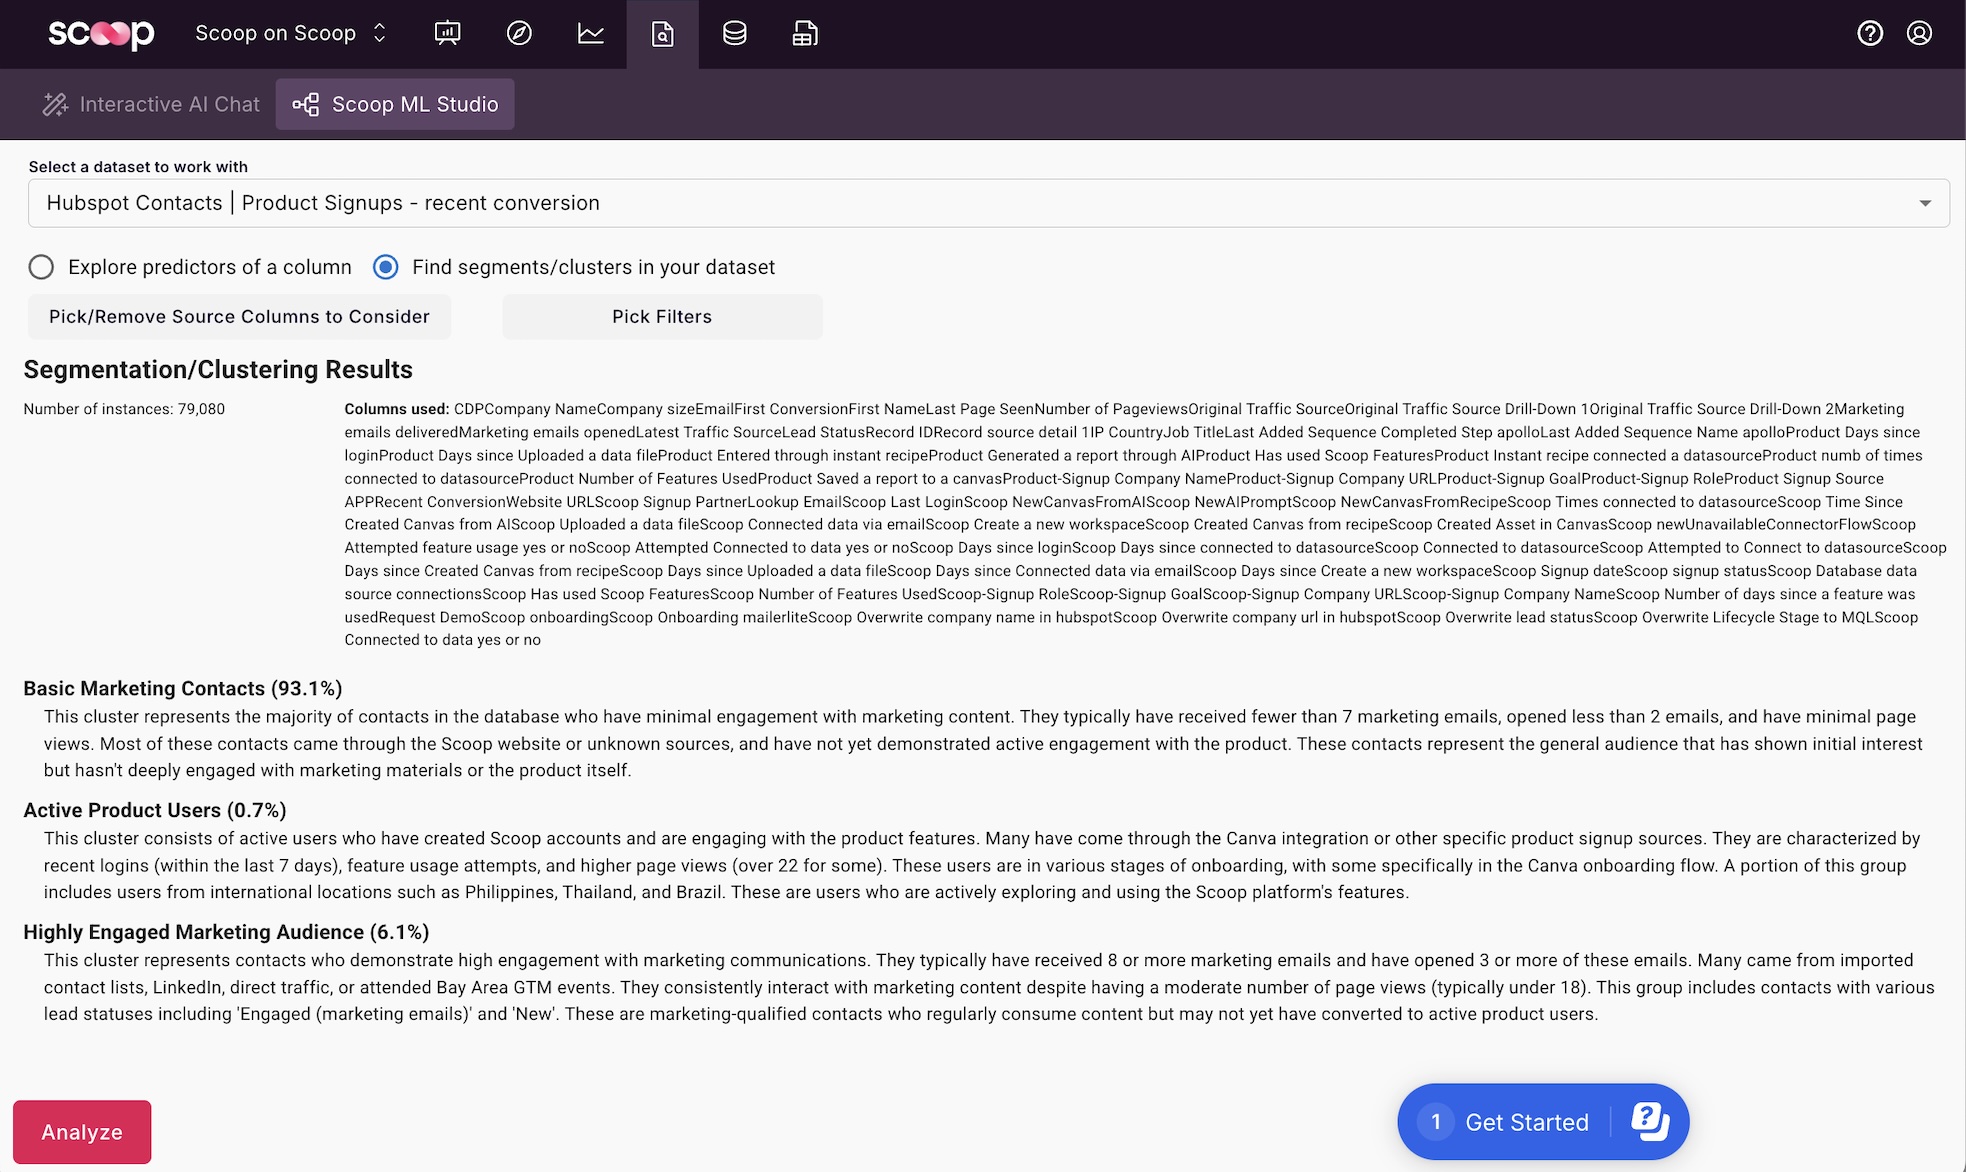
What’s driving conversions? Scoop finds which traits are most strongly tied to outcomes—like closed-won, churn, or expansion—and explains what’s influencing them.
Insert pre-built, modular data visuals into reports for quick, customizable insights.
Track data changes over time and analyze workflows to identify trends and optimize processes.
Customize fonts, colors, and layouts in Scoop Analytics for visually tailored reports and dashboards.
Segment data by shared traits over time to uncover trends, retention, and performance insights.
Get a quick view of key metrics and KPIs to assess business health and progress.
Refine forecasts using real-time data and updated assumptions for more accurate predictions.
Track and visualize every stage of your sales process, from lead generation to deal closure, for better pipeline management and forecasting.
Distribute open deals to your team in just a few clicks with our instant recipe and your preferred data source.
What’s driving conversions? Scoop finds which traits are most strongly tied to outcomes—like closed-won, churn, or expansion—and explains what’s influencing them.