Unveiling the New Scoop UI: Enhanced Features for Seamless Data Presentation and Analysis
What’s New?
Data Presentation Using Company Templates
Tired of wrestling with mismatched presentation formats? With Scoop, you can now present your data using your company's templates directly from the platform. Whether it's a PowerPoint deck, Google Slide deck, or any other format, this feature ensures your brand stays consistent while you breeze through your reports.
Enhanced Data Blending with Spreadsheets
Our enhanced data blending capabilities allow you to seamlessly merge various data sources. Imagine effortlessly combining your sales data with marketing metrics to get a comprehensive view of your business performance.
Sales and Marketing Stage Conversion Analysis
Meet your new best friends: process diagrams and Sankey charts. These visual tools make it a cinch to understand the flow of sales and marketing stages. Identify bottlenecks and optimize your conversion process with a few clicks. Your pipeline never looked so good!
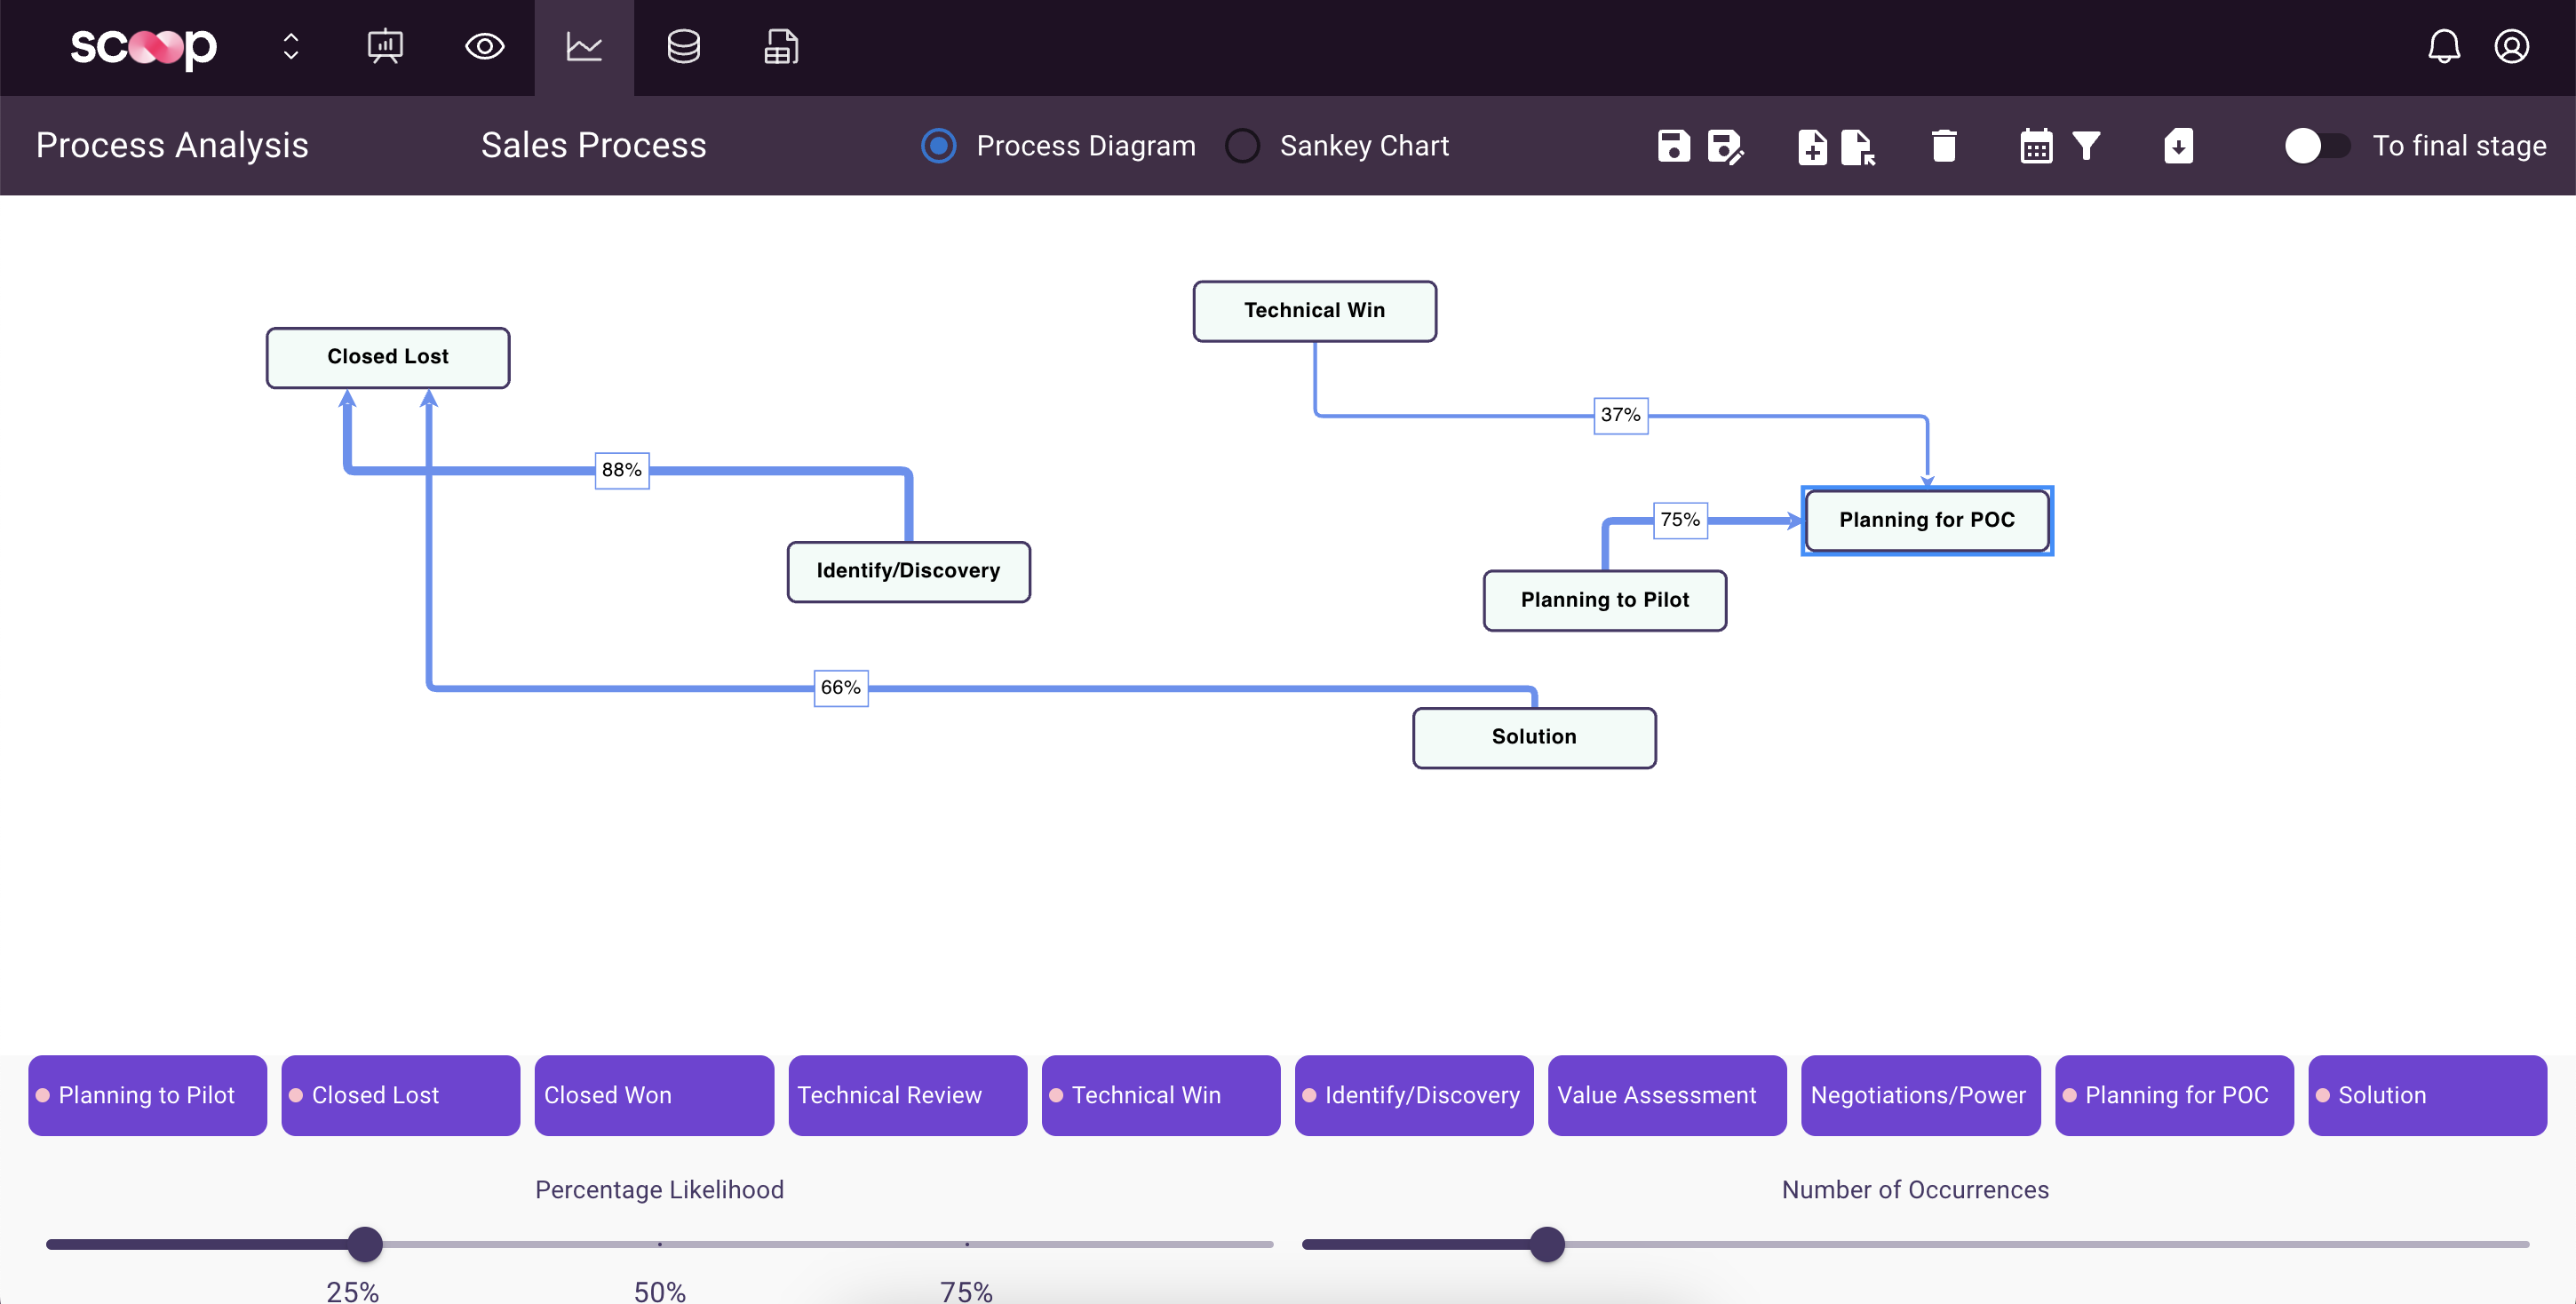
Process Diagram
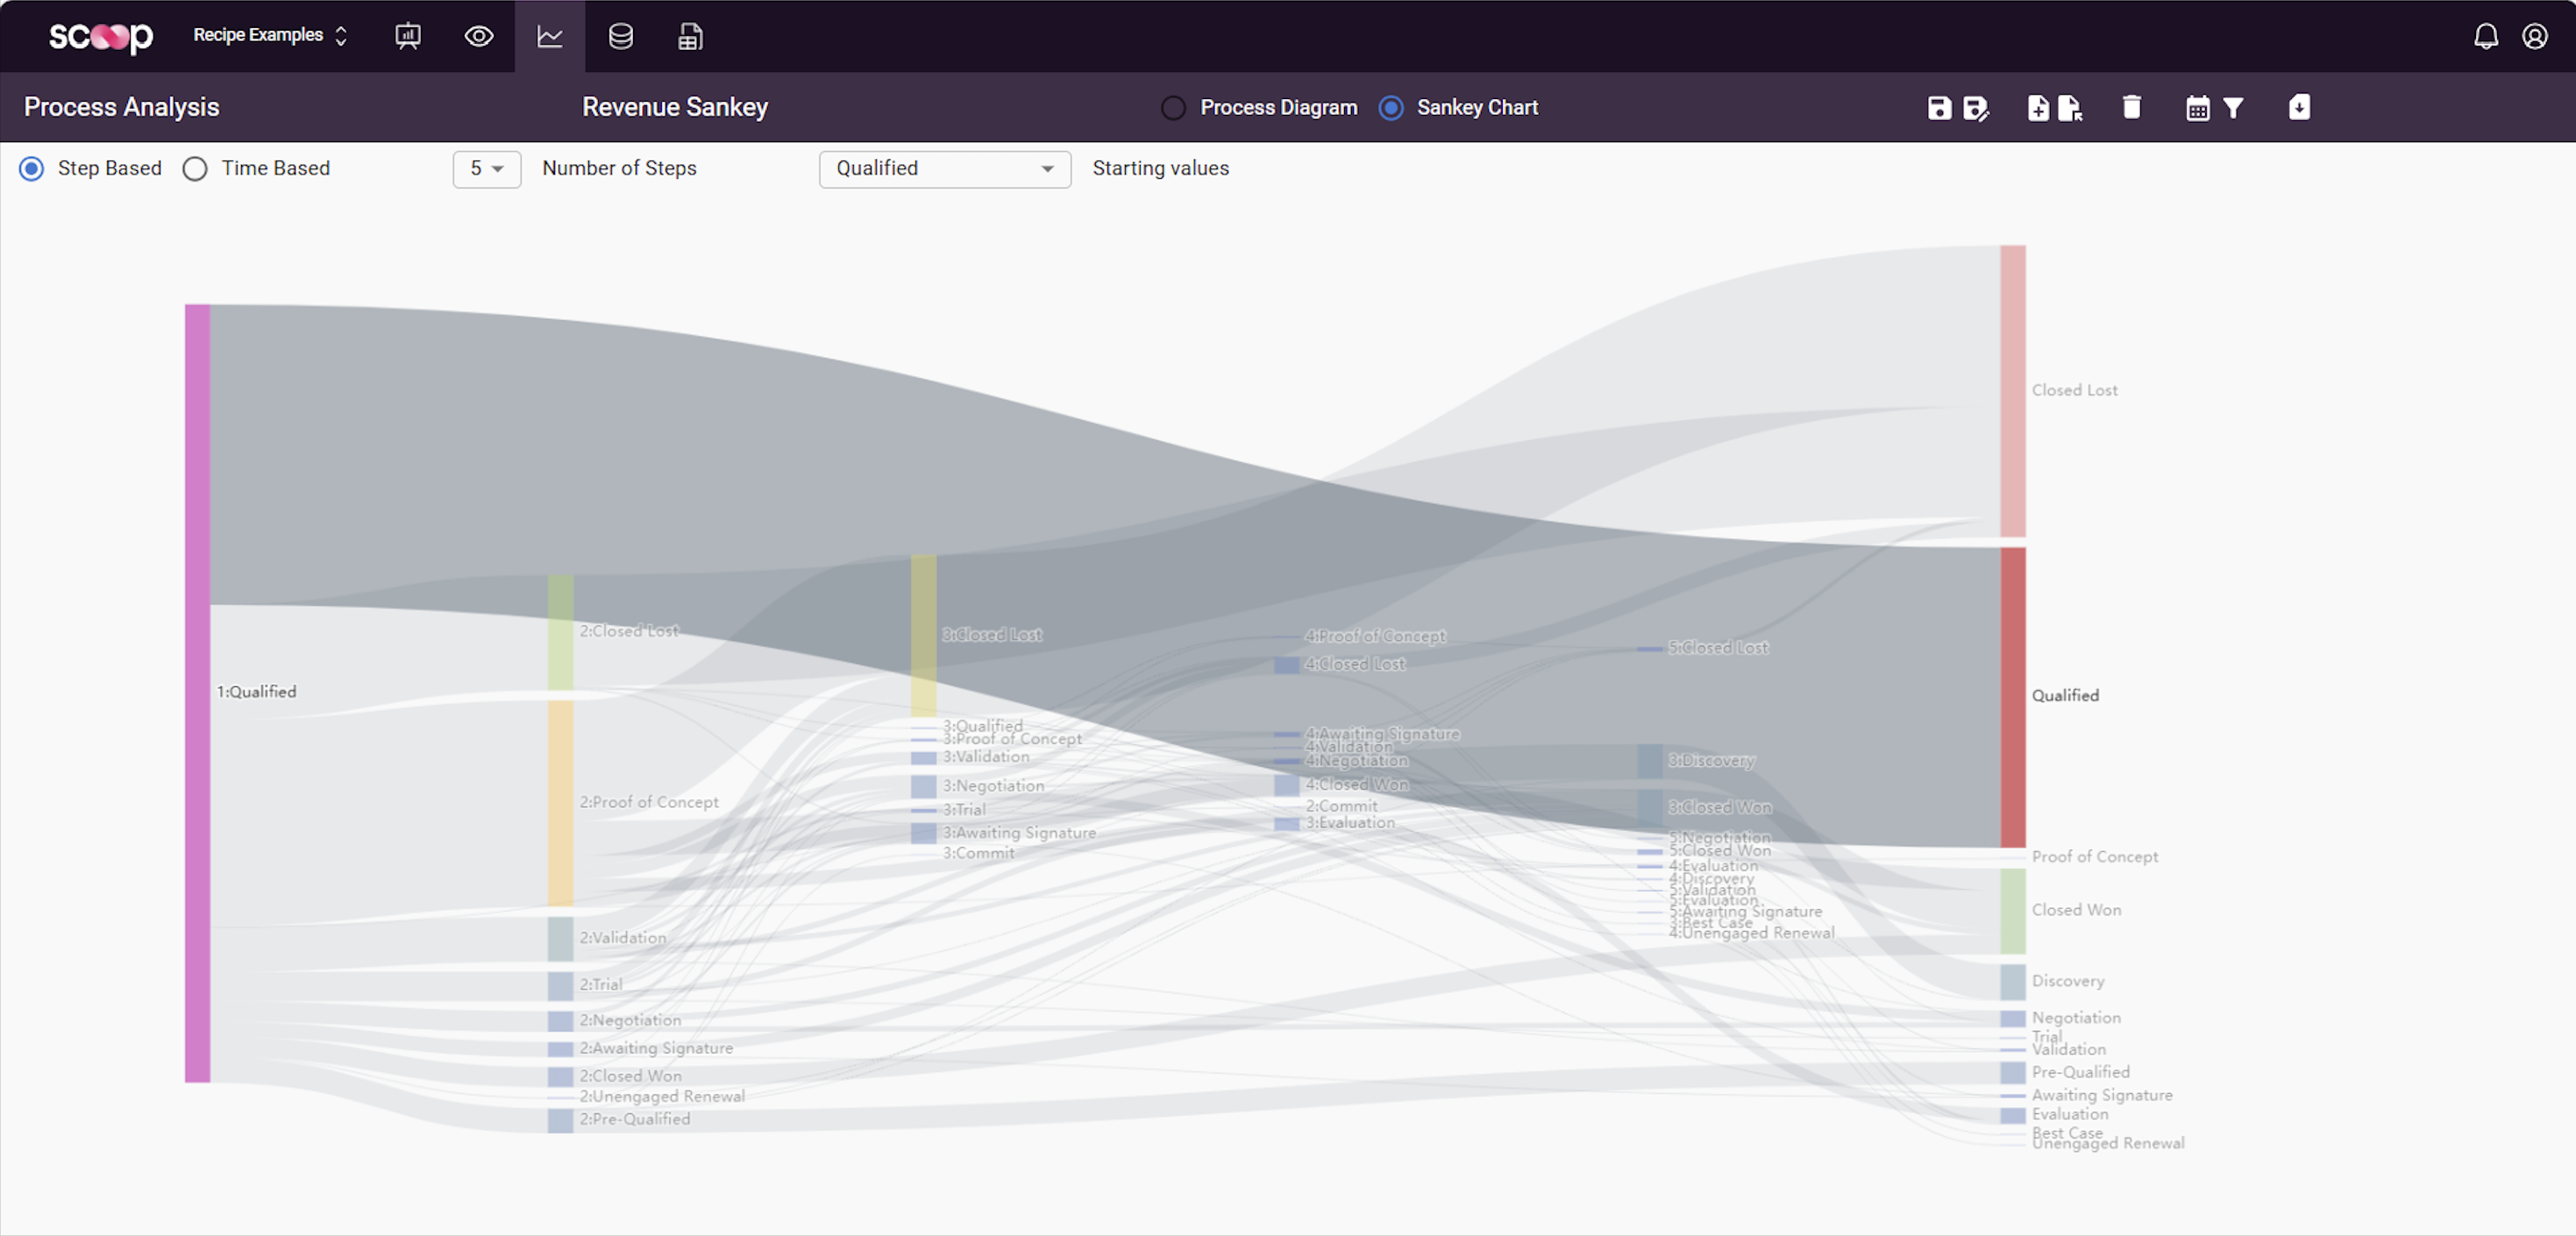
Sankey Chart
Continuing Excellence
The new Scoop UI includes all the features you already love, plus some extra sparkle. You can still grab data from any operational system, integrate charts and dashboards, and include spreadsheets directly on your dashboard. Keep all your crucial data points connected and accessible with ease.
Real-World Benefits
Imagine saving hours every week by automating your reports. With Scoop, this is not just a possibility but a reality. By bringing all your data and reporting tools into one platform, you can say goodbye to the chaos of switching between multiple applications and hello to improved efficiency.
Use Cases
- Marketing Teams: Combine campaign performance data with sales outcomes to refine strategies. Marketing just got a whole lot smarter.
- Sales Teams: Utilize process diagrams and Sankey charts to better understand your pipeline and improve forecasting accuracy. Close those deals faster!
- Executive Reporting: Use Scoop for board meetings, with live data updates ensuring your presentations are always current and insightful. Impress your board with minimal effort.
Get Started With Scoop Today!
Stop spending hours creating your weekly reports – start Scooping! Sign up for a demo or a free trial and experience the benefits of the new Scoop UI firsthand. We’re excited to hear your feedback and see how Scoop transforms your data reporting process.