
AI data analytics tools
Small businesses now run on the same caliber of AI data analysis tools that used to sit behind enterprise budgets and dedicated data teams.
The right platform turns messy data from your CRM, your spreadsheets, and your billing system into decisions you can act on.
No data scientist. No SQL.
This guide breaks down the 10 tools worth evaluating in 2026, what each one actually does, and how to pick the one your team will still be using in six months.
Here is the short version
- If you live in spreadsheets and need to blend data from many systems, start with Scoop.
- If you are already deep in Microsoft, Power BI with Copilot is the natural fit.
- On zero budget, Google Looker Studio gets you a professional dashboard today.
The rest of this guide explains why, and where each tool breaks down.

What are AI data analysis tools?
And why should small businesses care?
AI data analysis tools are software platforms that use:
- Machine learning
- Natural language processing
- Statistical modeling to find patterns
- Generate forecasts
- Surface insights from your business data
You connect your sources. You ask a question in plain English. You get an answer.
The shift matters because most small business owners did not start a company to build pivot tables.
Data piles up across:
- CRM systems
- E-commerce platforms
- Marketing dashboards
- Accounting software
Without AI to interpret it, decisions get made on instinct while better-equipped competitors decide on evidence.
These tools earn their keep in 4 ways:
- They automate reporting so your Monday review reflects Friday's numbers, not last Tuesday's.
- They forecast demand, churn, and revenue from your own history.
- They flag anomalies the moment a metric moves the wrong way.
- They answer plain-English questions instead of forcing you to learn a query language.
The global augmented analytics market is projected to reach roughly $68 billion in 2026, and more than 80% of organizations now use AI in at least one business function.
How do AI data analysis tools actually work?
At the core, these tools connect to your existing data sources, then apply algorithms to surface trends you would never catch by hand.
The interface differs by tool, but the mechanics share a pattern:
- You connect a source: a spreadsheet, a CRM like Salesforce or HubSpot, a database, or a cloud warehouse.
- You ask a question in natural language, or the tool monitors your metrics on its own.
- The AI translates the question, runs the analysis, and returns an answer with a chart or a short explanation.
Instead of spending 3 hours building a pivot table to figure out why October revenue dipped, you type the question and the tool surfaces the top contributing factors.
The best platforms go further and investigate the why behind the number, which is where most dashboards stop short.
What are the best AI data analysis tools for small businesses?
Not every platform fits a small team.
Some assume an enterprise data department.
Others are built for people who just want answers fast.
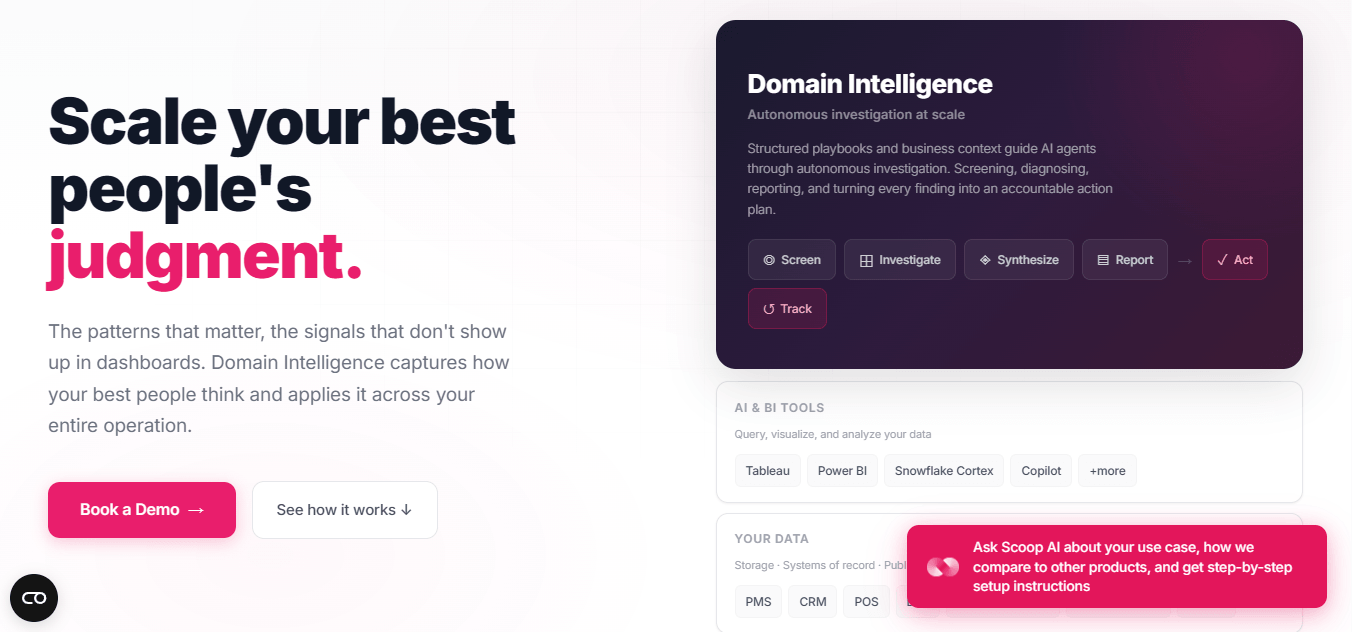
1. Scoop Analytics
Best for operations leaders who live in spreadsheets
If you are an operations leader blending data from many sources without writing code or waiting on IT, Scoop was built for your job.
It sits in the augmented analytics category:
AI that enhances how you work with data rather than handing you another chart to interpret.
The difference shows up in what Scoop does after the question.
- It connects your CRM, marketing tools, and spreadsheets
- It investigates like a senior analyst:
- Testing hypotheses
- Finding patterns
- Surfaces what is actually driving your numbers
The Scoop’s promise is interpretation, not just visualization.
We tell you what the data means, not just what it shows.
What Scoop does well:
- Connects to 150+ data sources including HubSpot, Salesforce, QuickBooks, and Google Sheets, with no-code data blending across all of them.
- Runs automated data pipelines and scheduled refreshes, so reports stay current without manual effort.
- Performs root cause investigation on your blended data instead of stopping at a dashboard.
- Works inside Slack, so you can ask questions and get insights where your team already talks.
- Built for ops leaders and analysts, not data engineers.
For a team tired of copy-pasting data between systems every week, Scoop's self-serve analytics eliminates that entire category of work.
For executives who want investigation rather than reporting, Scoop's Domain Intelligence layer sits on top of your existing stack and delivers a weekly report on what changed and what to do next.
Best for:
Operations leaders who blend data from multiple sources and want answers, not dashboards.
Pricing:
Custom. Available on request.
2. Microsoft Power BI with Copilot
Best for Microsoft-first teams
If your team already lives in Microsoft 365, Power BI is the natural extension.
The Copilot integration lets you describe a report in plain English and watch it get built.
The free desktop version is genuinely capable, and if you are comfortable in Excel the transition is manageable.
The 2026 pricing reality check:
Microsoft raised Power BI Pro from $10 to $14 per user per month in April 2025, and Premium Per User from $20 to $24. Pro no longer includes Copilot. Power BI Copilot now requires Premium Per User or Fabric capacity at F64 and above, which starts around $5,000 per month. For a small team, that puts AI features further out of reach than the headline Pro price suggests.
- Strong native fit with Excel, Teams, and SharePoint.
- Real learning curve once you move past basic reports.
- Copilot is gated behind PPU ($24/user/mo) or Fabric capacity, not the base Pro tier.
Best for:
Microsoft ecosystem teams that want AI-assisted reporting and can justify the PPU tier.
Pricing:
- Desktop free.
- Pro $14/user/mo.
- PPU $24/user/mo.
- Fabric capacity from roughly $262/mo.
3. Google Looker Studio
Best free option
No budget?
Google Looker Studio is free with no caps on core features.
If your data lives in:
- Google Analytics
- Google Ads
- Google Sheets
It is the fastest path to a professional, shareable dashboard.
Think of it as Google Slides for your data.
- Completely free for core reporting and sharing.
- Best when your stack is already inside Google.
- Limited native AI compared with paid platforms, and connecting non-Google data takes more effort.
Best for:
Lean teams and startups that need professional reporting immediately, with no procurement process.
Pricing:
Free. Looker Studio Pro adds team features at about $9 per user per month.

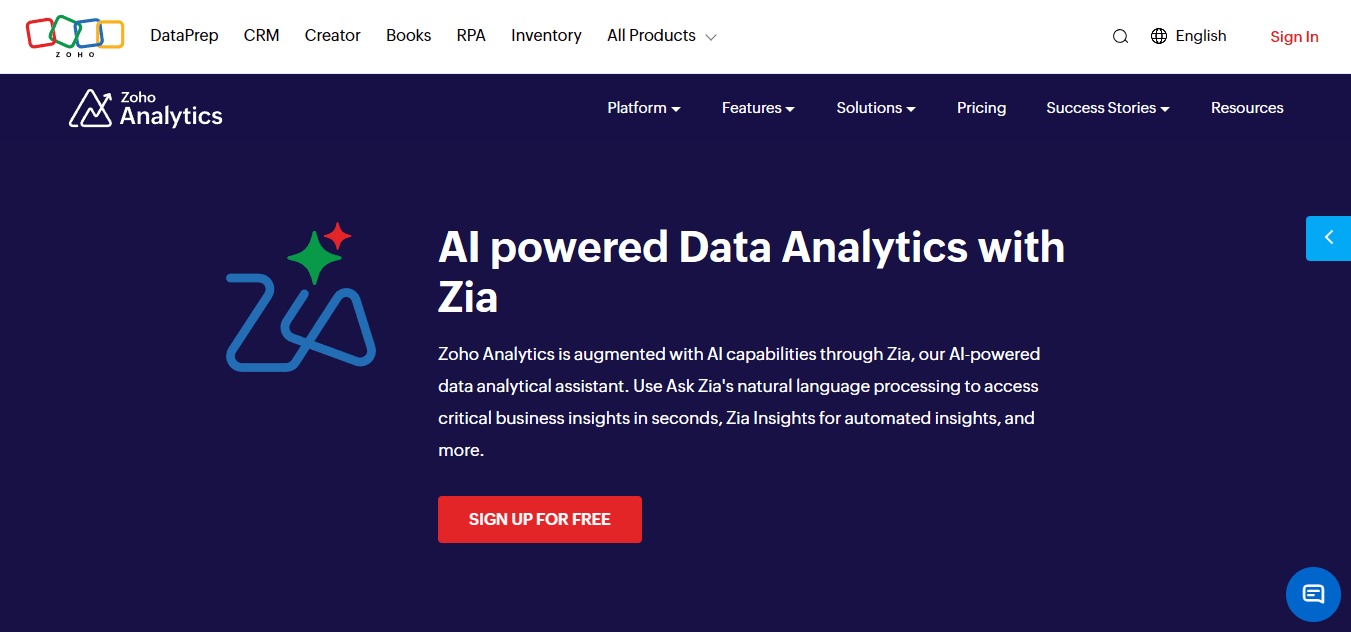
4. Zoho Analytics with Zia AI
Best SMB all-in-one
Zoho's strength is integration.
If you already use Zoho CRM or Zoho Books, the analytics layer connects everything automatically.
The Ask Zia assistant lets you query data conversationally and sends proactive alerts when a KPI shifts.
Pricing is per organization, not per user, which keeps small teams affordable as they grow.
- Priced per account, so adding viewers does not multiply your bill.
- Ask Zia handles natural-language questions and surfaces unexpected anomalies.
- Visualization depth and large data models lag behind Power BI and Tableau.
Best for:
Small businesses in the Zoho ecosystem or anyone wanting an affordable all-in-one analytics layer.
Pricing:
- Free plan for 2 users
- Basic $30/mo
- Standard $60/mo
- Premium around $145/mo
All billed annually.
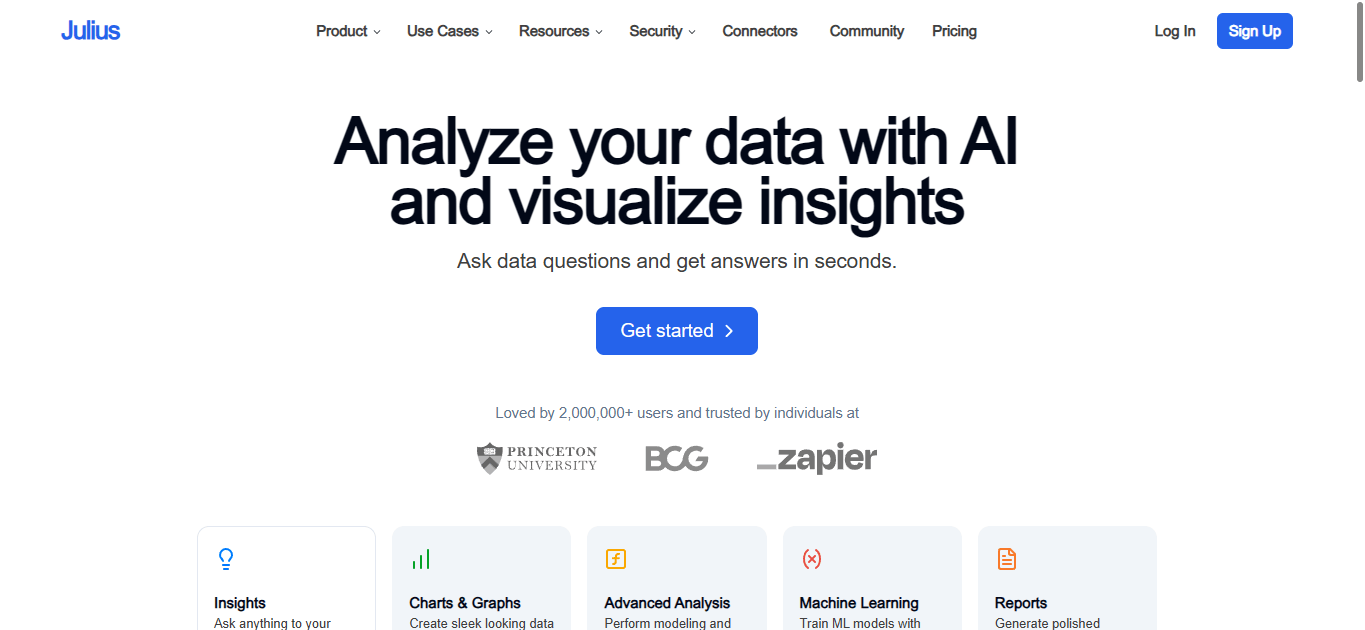
5. Julius AI
Best for conversational analysis of uploaded data
Julius is one of the newer AI-first tools, and it is built around a single idea:
- Upload a file or connect a database
- Ask questions in plain English
- Get charts, tables, and reports back without writing code
It connects live sources like Postgres, Snowflake, and BigQuery, and it leans into natural language analytics as the primary interface.
- Fast path from a raw file to a usable answer, with no setup overhead.
- Good fit for ad hoc exploration and one-off questions.
- Less suited to recurring, governed operational reporting across many connected systems.
Best for:
Teams that need quick, conversational answers from spreadsheets or a single database.
Pricing:
- Free tier available.
- Paid plans from about $20 per month.
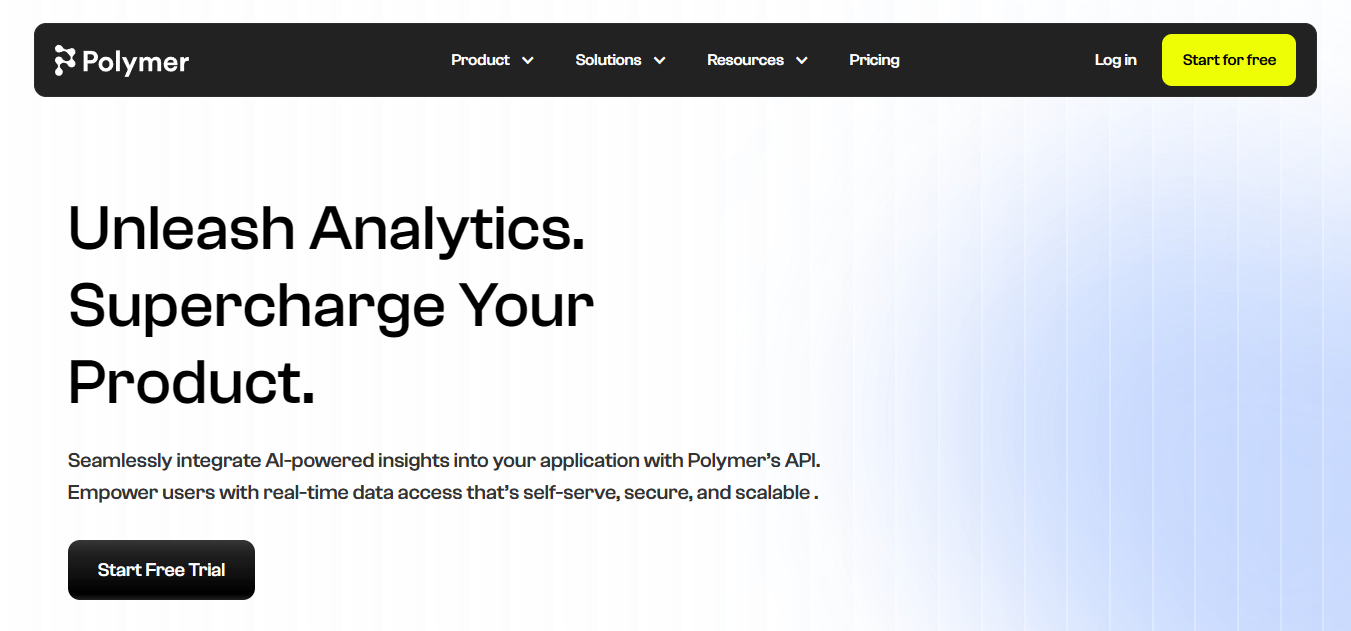
6. Polymer
Best for turning spreadsheets into dashboards fast
Polymer sits in the spreadsheet-to-dashboard category.
Upload a spreadsheet or connect a source, and it transforms the data into an interactive, explorable view in minutes.
Its AI suggests visualizations and surfaces relationships you would not have thought to chart.
- Minimal setup: a spreadsheet becomes a dashboard almost immediately.
- AI-suggested charts speed up exploration for non-technical users.
- Built for presentation and exploration more than deep, multi-source investigation.
Best for:
Small teams that want a quick, attractive dashboard from existing spreadsheets.
Pricing:
- Free trial.
- Paid plans from about $25 per user per month, billed annually.
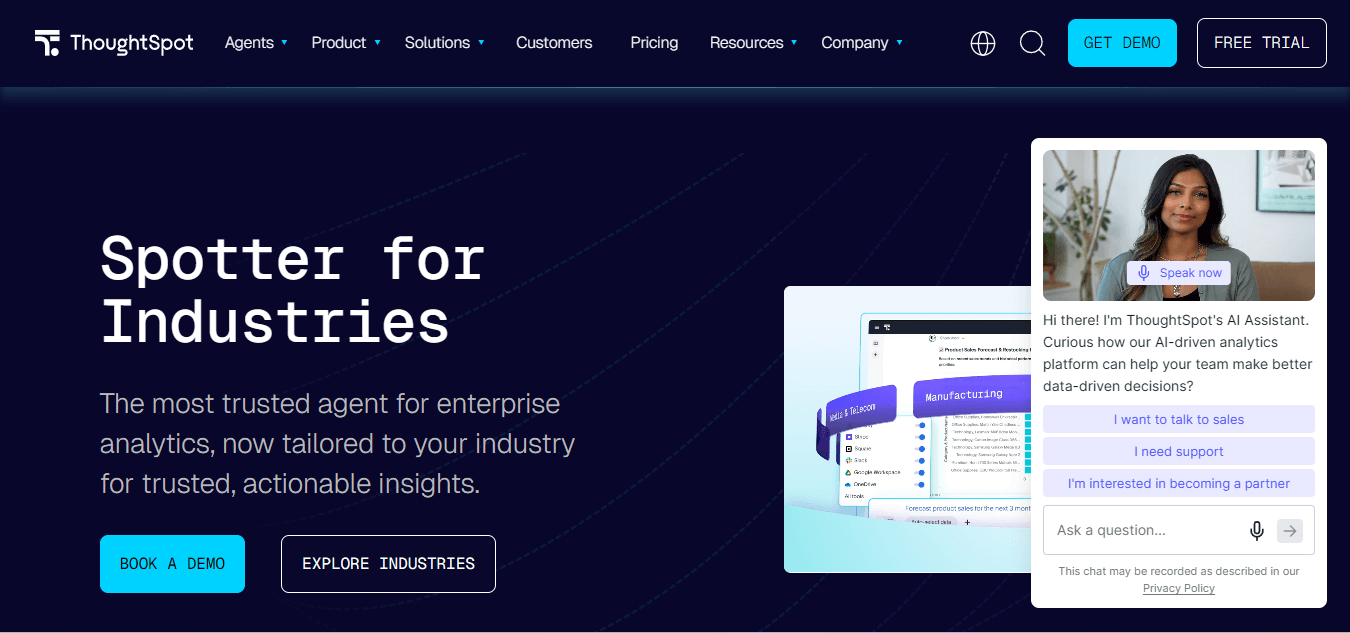
7. ThoughtSpot
Best for search-driven analytics
ThoughtSpot replaces dashboards and menus with a search bar.
Type a question the way you would Google something, and get an instant answer with an AI-generated visualization.
Its SpotIQ feature automatically identifies anomalies and trends you would not have thought to look for.
- Search-style interface is approachable for non-technical leaders.
- SpotIQ surfaces anomalies automatically.
- Priced for larger teams, which makes it a stretch for the smallest businesses.
Best for:
Business leaders who want instant answers without learning a new interface.
Pricing:
- Team edition from around $1,250/mo.
- Enterprise pricing is custom.
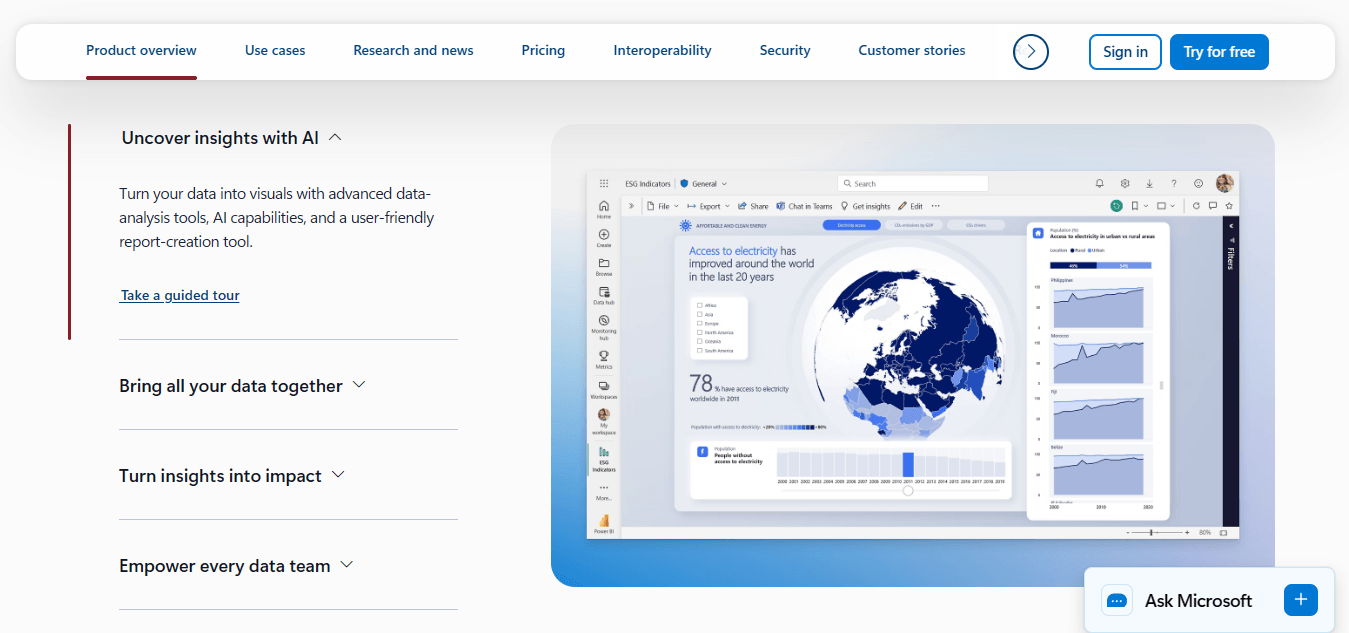
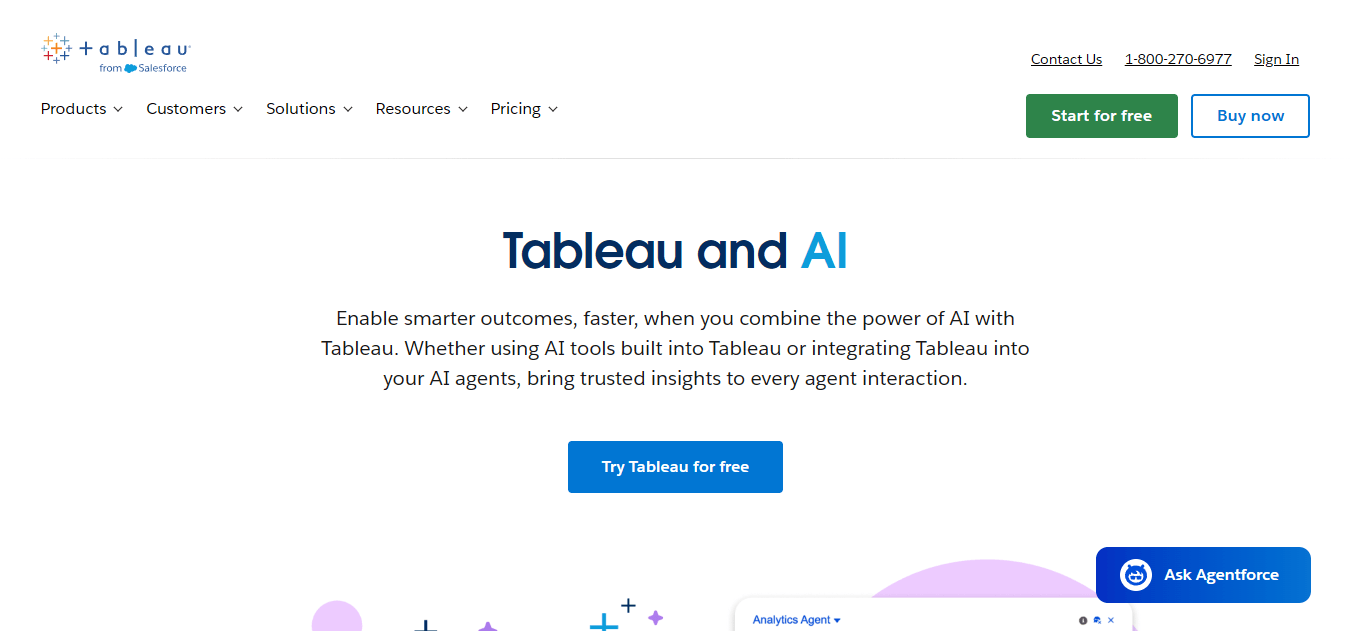
8. Tableau with Einstein AI
Best for visual data exploration
Tableau has long been the standard for data visualization.
With Einstein AI explaining why data points are unusual and surfacing statistical insights, it is a legitimate AI-powered platform.
The tradeoff is complexity and cost.
- Top-tier visualization output for teams with real design needs.
- Steeper learning curve than most tools on this list.
- Creator seats are the most expensive per-user option here.
Best for:
Teams that prioritize visual depth and will invest time learning the platform.
Pricing:
- Viewer from $15
- Explorer $42
- Creator $75 per user per month
9. Qlik Sense
Best for associative data exploration
Qlik Sense uses an associative engine that lets you explore data freely in any direction rather than down predefined paths.
Its Insight Advisor adds AI-generated suggestions and natural-language interaction.
It is more capable than most SMB tools and correspondingly more involved to set up.
- Associative model is powerful for open-ended exploration.
- Insight Advisor brings AI suggestions and NL querying.
- More setup and governance than a spreadsheet-first team usually wants.
Best for:
Growing teams that need flexible exploration beyond linear dashboards.
Pricing:
Qlik Sense Business around $30 per user per month.
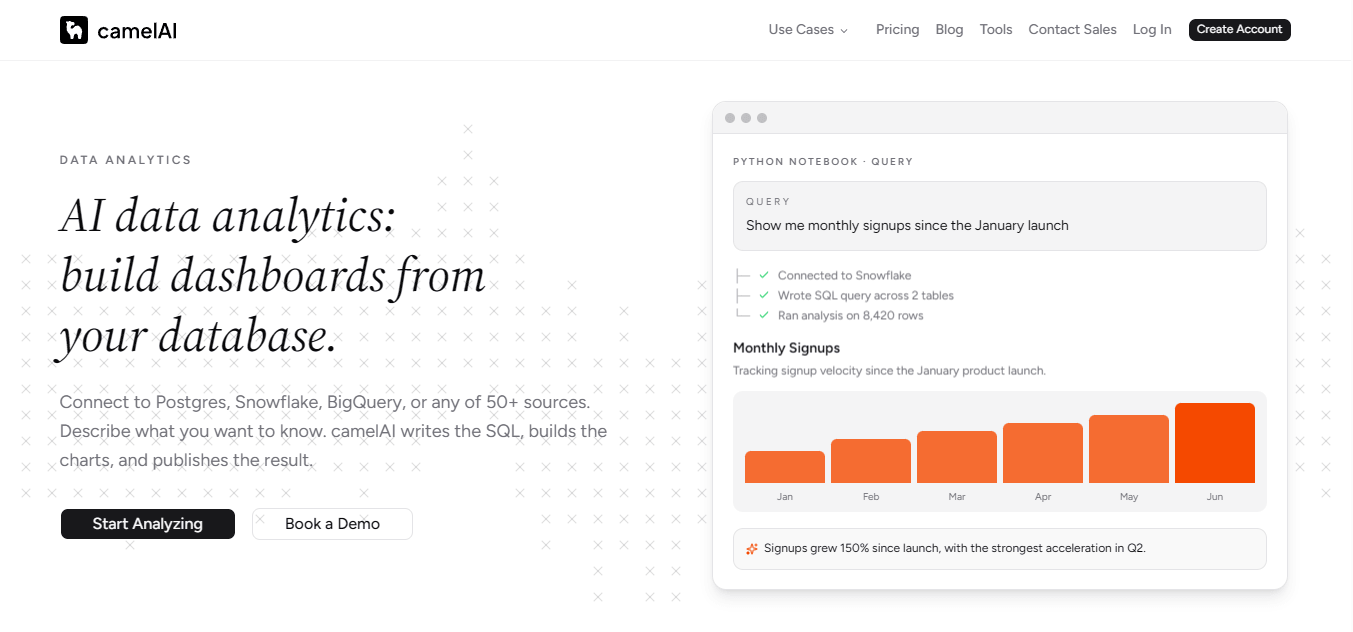
10. camelAI
Best free AI-first option
camelAI is a newer AI-native tool that connects to your database or spreadsheet and answers questions in plain English, generating charts and queries behind the scenes. It is one of the few genuinely AI-first platforms with a meaningful free tier, which makes it a low-risk way to test whether conversational analytics fits your team.
- AI-native interface with a usable free tier.
- Connects directly to common databases and spreadsheets.
- Younger product with a smaller ecosystem than the established names.
Best for:
Budget-conscious teams that want to try AI-first analytics before committing.
Pricing:
- Free tier available.
- Paid plans scale with usage.
What AI techniques should small businesses prioritize?
Most teams evaluate platforms against a feature list.
The better question is which capability solves the problem in front of you.
Four techniques deliver the most immediate value for small businesses, and you can map each to a tool above.
Natural language querying
This is the ability to ask a question in plain English and get an instant answer.
No SQL. No pivot tables.
For non-technical owners, natural language querying is the single most useful capability in modern analytics because it removes the gatekeeping that used to require an analyst.
Look for:
Plain-English questions, follow-up questions, and clear explanations of the answer.
Strong examples:
- Scoop Analytics
- Julius AI
- ThoughtSpot
- camelAI
Automated anomaly detection
You cannot watch every metric every day.
Anomaly detection monitors your KPIs and alerts you when something unusual happens:
- A drop in conversion
- A spike in refunds
- A supplier slipping on delivery
It is the closest thing to an analyst watching your data around the clock.
Look for:
Proactive alerts, not just dashboards you have to remember to open.
Strong examples:
- Scoop Analytics
- Zoho Ask Zia
- ThoughtSpot SpotIQ.
Predictive analytics
Predictive analytics uses your history to forecast what is likely to happen next.
For a retailer that means forecasting demand before a seasonal spike.
For a service business it means flagging clients at risk of churning.
These are not hypotheticals, and the difference between descriptive and predictive analytics is what separates reporting from planning.
Look for:
Forecasts tied to a decision, with the drivers behind the prediction shown.
Useful background:
How predictive analytics and machine learning relate.
Automated data pipelines
This is the unglamorous capability that saves the most time.
If your team manually downloads CSVs, copies data between systems, or spends Friday refreshing reports, automated data pipelines remove all of it by keeping connected sources synchronized on their own.
Look for:
Scheduled refreshes and multi-source blending without engineering help.
Strong examples:
- Scoop Analytics
- Power BI
- Zoho Analytics
How are small businesses actually using these tools?
Theory is one thing. Here is how small teams put these platforms to work right now, each tied to a technique from the previous section.
Inventory optimization:
A boutique e-commerce retailer forecasts demand by product category, cutting overstock by 30% and avoiding most peak-season stockouts.
Customer churn prediction:
A 200-customer SaaS startup flags accounts at risk of canceling 60 days out, giving sales time to intervene.
Operations reporting:
A regional services company blends CRM, project management, and billing data into a weekly review that used to take half a day and now assembles itself.
Marketing performance:
An agency connects Google Analytics, HubSpot, and ad platforms to surface which campaigns drive closed revenue, not just clicks.
The common thread is that none of these are companies with data teams.
They are companies with operations leaders who got tired of not having answers and found tools that produce them automatically.

How do you choose the right AI data analysis tool?
The decision feels overwhelming until you work through five questions in order. Start with the problem, not the feature list.
1. What is the primary problem?
- Reporting automation
- Forecasting
- Customer insight
- Operational visibility
Start with one specific pain, not a general desire for better data.
2. Where does your data live?
If it is scattered across five systems, you need strong connectivity and blending first.
If it is mostly in one place, you have more flexibility.
3. Who needs to use it?
A tool that requires SQL is useless if your team is non-technical.
Prioritize natural-language interfaces for daily users.
4. What does your budget actually allow?
Free tiers exist for a reason.
Looker Studio, Zoho, and camelAI let you validate adoption before you commit.
5. Does it integrate with what you already use?
A beautiful tool that cannot connect to your CRM is one you will abandon in three months.
The best AI data analysis tool is the one your team actually opens every morning. That should be the bar.
What are the biggest challenges when adopting AI analytics tools?
AI analytics tools solve real problems and introduce real challenges, especially for small businesses without a data team.
Plan for these four before you buy.
Data quality:
AI is only as good as the data underneath it.
Duplicate CRM contacts and inconsistent spreadsheets undermine any tool.
Clean data is a prerequisite, and data-driven decision making depends on it.
Change management:
Getting a team to change how it gets information is harder than picking a tool.
Budget time for training, or the investment will not stick.
Integration depth:
Some platforms advertise hundreds of integrations but deliver shallow connectivity.
Test the specific connections you need during a trial.
Cost creep:
Per-user and per-row pricing scales fast.
A plan that is affordable at five users can sting at fifteen.
The Power BI Copilot gating above is a live example, (read the tiers carefully).

Frequently asked questions
What is the easiest AI data analysis tool for non-technical users?
Google Looker Studio, camelAI, and Zoho Analytics with Zia are the easiest entry points thanks to low learning curves and visual or conversational interfaces. For teams that need more powerful data blending without technical complexity, Scoop is built for operations leaders rather than engineers.
- Easiest free start: Looker Studio or camelAI.
- Easiest with multi-source blending: Scoop.
Do I need to know SQL to use AI data analytics tools?
No. The best modern tools are designed to eliminate SQL. Platforms like Scoop, ThoughtSpot, and Julius AI use natural language queries and handle query generation behind the scenes. If a tool requires SQL for basic tasks, that is a red flag for small business adoption.
- Plain-English questions replace query writing in every tool on this list except the most technical Power BI and Tableau workflows.
What is the difference between predictive analytics and business intelligence?
Business intelligence describes what already happened: last quarter's revenue, customer counts, ticket volume. Predictive analytics uses that history to forecast what is likely next. Modern tools increasingly combine both in one view.
- BI looks backward. Prediction looks forward. The best tools do both and explain the drivers.
How much do AI data analysis tools cost for small businesses?
Costs range from free (Looker Studio, camelAI free tier) to $20 to $60 per month for SMB platforms like Julius AI and Zoho, to $14 to $75 per user per month for Power BI and Tableau. Enterprise-grade ThoughtSpot starts around $1,250 per month. Note that Power BI Copilot now requires the $24 PPU tier or Fabric capacity, not the base Pro license.
- Free to validate: Looker Studio, camelAI, Zoho free plan.
- Per-user platforms add up fast as the team grows. Check the AI gating before you budget.
Can small businesses realistically benefit from AI analytics?
Yes, and skipping AI analytics is increasingly its own disadvantage. Teams that automate data collection, reporting, and anomaly detection free up real operational time and decide faster. The 2026 tools are built for accessibility, not just enterprise budgets.
- The barrier to entry has never been lower, and the free tiers prove fit before you spend.


